


一、Prometheus安装及配置
1、下载及解压安装包
cd /usr/local/src/

export VER="2.13.1"
wget https://github.com/prometheus/prometheus/releases/download/v${VER}/prometheus-${VER}.linux-amd64.tar.gz

mkdir -p /data0/prometheus
groupadd prometheus
useradd -g prometheus prometheus -d /data0/prometheus

tar -xvf prometheus-${VER}.linux-amd64.tar.gz
cd /usr/local/src/
mv prometheus-${VER}.linux-amd64 /data0/prometheus/prometheus_server

cd /data0/prometheus/prometheus_server/
mkdir -p {data,config,logs,bin}
mv prometheus promtool bin/
mv prometheus.yml config/

chown -R prometheus.prometheus /data0/prometheus
2 、设置环境变量
vim /etc/profile

PATH=/data0/prometheus/prometheus_server/bin:$PATH:$HOME/bin

source /etc/profile
3、检查配置文件
promtool check config /data0/prometheus/prometheus_server/config/prometheus.yml

Checking /data0/prometheus/prometheus_server/config/prometheus.yml
  SUCCESS: 0 rule files found
4、创建prometheus.service 的 systemd unit 文件
- 4.1、常规服务
sudo tee /etc/systemd/system/prometheus.service <<-'EOF'
[Unit]
Description=Prometheus
Documentation=https://prometheus.io/
After=network.target

[Service]
Type=simple
User=prometheus
ExecStart=/data0/prometheus/prometheus_server/bin/prometheus --config.file=/data0/prometheus/prometheus_server/config/prometheus.yml --storage.tsdb.path=/data0/prometheus/prometheus_server/data --storage.tsdb.retention=60d
Restart=on-failure

[Install]
WantedBy=multi-user.target
EOF

systemctl enable prometheus.service
systemctl stop prometheus.service
systemctl restart prometheus.service
systemctl status prometheus.service
4.2、使用supervisor管理prometheus_server
yum install -y epel-release supervisor

sudo tee /etc/supervisord.d/prometheus.ini<<-"EOF"
[program:prometheus]
# 启动程序的命令;
command = /data0/prometheus/prometheus_server/bin/prometheus --config.file=/data0/prometheus/prometheus_server/config/prometheus.yml --storage.tsdb.path=/data0/prometheus/prometheus_server/data --storage.tsdb.retention=60d
# 在supervisord启动的时候也自动启动;
autostart = true
# 程序异常退出后自动重启;
autorestart = true
# 启动5秒后没有异常退出,就当作已经正常启动了;
startsecs = 5
# 启动失败自动重试次数,默认是3;
startretries = 3
# 启动程序的用户;
user = prometheus
# 把stderr重定向到stdout,默认false;
redirect_stderr = true
# 标准日志输出;
stdout_logfile=/data0/prometheus/prometheus_server/logs/out-prometheus.log
# 错误日志输出;
stderr_logfile=/data0/prometheus/prometheus_server/logs/err-prometheus.log
# 标准日志文件大小,默认50MB;
stdout_logfile_maxbytes = 20MB
# 标准日志文件备份数;
stdout_logfile_backups = 20
EOF

systemctl daemon-reload
systemctl enable supervisord
systemctl stop supervisord
systemctl restart supervisord
supervisorctl restart prometheus
supervisorctl status
5、prometheus.yml配置文件
#创建Alertmanager告警规则文件
mkdir -p /data0/prometheus/prometheus_server/rules/
touch /data0/prometheus/prometheus_server/rules/node_down.yml
touch /data0/prometheus/prometheus_server/rules/memory_over.yml
touch /data0/prometheus/prometheus_server/rules/disk_over.yml
touch /data0/prometheus/prometheus_server/rules/cpu_over.yml

#prometheus配置文件
cat > /data0/prometheus/prometheus_server/config/prometheus.yml << EOF
# my global config
global:
  scrape_interval: 15s # 设置抓取(pull)时间间隔,默认是1m
  evaluation_interval: 15s # 设置rules评估时间间隔,默认是1m
  # scrape_timeout is set to the global default (10s).

# 告警管理配置,默认配置
alerting:
  alertmanagers:
  - static_configs:
    - targets:
      - 192.168.56.11:9093 # 这里修改为 alertmanagers 的地址

# 加载rules,并根据设置的时间间隔定期评估
rule_files:
# - "first_rules.yml"
# - "second_rules.yml"
  - "/data0/prometheus/prometheus_server/rules/node_down.yml"                 # 实例存活报警规则文件
  - "/data0/prometheus/prometheus_server/rules/memory_over.yml"               # 内存报警规则文件
  - "/data0/prometheus/prometheus_server/rules/disk_over.yml"                 # 磁盘报警规则文件
  - "/data0/prometheus/prometheus_server/rules/cpu_over.yml"                  # cpu报警规则文件

# 抓取(pull),即监控目标配置
# 默认只有主机本身的监控配置
scrape_configs:
  # The job name is added as a label `job=<job_name>` to any timeseries scraped from this config.
  - job_name: 'prometheus'

    # metrics_path defaults to '/metrics'
    # scheme defaults to 'http'.

    # 可覆盖全局配置设置的抓取间隔,由15秒重写成5秒。
    scrape_interval: 10s

    static_configs:
      - targets: ['localhost:9090', 'localhost:9100']

  - job_name: 'DMC_HOST'
    file_sd_configs:
      - files: ['./hosts.json']
      # 被监控的主机,可以通过static_configs罗列所有机器,这里通过file_sd_configs参数加载文件的形式读取
      # 被监控的主机,可以json或yaml格式书写,我这里以json格式书写,target里面写监控机器的ip,labels非必须,可以由你自己定
EOF

#file_sd_configs参数形式配置主机列表
cat > /data0/prometheus/prometheus_server/config/hosts.json << EOF
[
{
"targets": [
  "192.168.56.11:9100",
  "192.168.56.12:9100",
  "192.168.56.13:9100"
],
"labels": {
    "service": "db_node"
    }
},
{
"targets": [
  "192.168.56.14:9100",
  "192.168.56.15:9100",
  "192.168.56.16:9100"
],
"labels": {
    "service": "web_node"
    }
}
]
EOF

# 服务器存活报警
cat > /data0/prometheus/prometheus_server/rules/node_down.yml <<EOF
groups:
- name: 实例存活告警规则
  rules:
  - alert: 实例存活告警
    expr: up == 0
    for: 1m
    labels:
      user: prometheus
      severity: warning
    annotations:
      description: "{{ $labels.instance }} of job {{ $labels.job }} has been down for more than 1 minutes."
EOF

# mem报警
cat > /data0/prometheus/prometheus_server/rules/memory_over.yml <<EOF
groups:
- name: 内存报警规则
  rules:
  - alert: 内存使用率告警
    expr: (node_memory_MemTotal_bytes - (node_memory_MemFree_bytes+node_memory_Buffers_bytes+node_memory_Cached_bytes )) / node_memory_MemTotal_bytes * 100 > 80
    for: 1m
    labels:
      user: prometheus
      severity: warning
    annotations:
      description: "服务器: 内存使用超过80%!(当前值: {{ $value }}%)"
EOF

# disk报警
cat > /data0/prometheus/prometheus_server/rules/disk_over.yml <<EOF
groups:
- name: 磁盘报警规则
  rules:
  - alert: 磁盘使用率告警
    expr: (node_filesystem_size_bytes - node_filesystem_avail_bytes) / node_filesystem_size_bytes * 100 > 80
    for: 1m
    labels:
      user: prometheus
      severity: warning
    annotations:
      description: "服务器: 磁盘设备: 使用超过80%!(挂载点: {{ $labels.mountpoint }} 当前值: {{ $value }}%)"
EOF

# cpu报警
cat > /data0/prometheus/prometheus_server/rules/cpu_over.yml <<EOF
groups:
- name: CPU报警规则
  rules:
  - alert: CPU使用率告警
    expr: 100 - (avg by (instance)(irate(node_cpu_seconds_total{mode="idle"}[1m]) )) * 100 > 90
    for: 1m
    labels:
      user: prometheus
      severity: warning
    annotations:
      description: "服务器: CPU使用超过90%!(当前值: {{ $value }}%)"
EOF
6、查看ui
Prometheus自带有简单的UI, http://192.168.56.11:9090/
http://192.168.56.11:9090/targets
http://192.168.56.11:9090/graph
二、node_exporter安装及配置
1、下载及解压安装包
cd /usr/local/src/

export VER="0.18.1"
wget https://github.com/prometheus/node_exporter/releases/download/v${VER}/node_exporter-${VER}.linux-amd64.tar.gz

mkdir -p /data0/prometheus
groupadd prometheus
useradd -g prometheus prometheus -d /data0/prometheus

tar -xvf node_exporter-${VER}.linux-amd64.tar.gz
cd /usr/local/src/
mv node_exporter-${VER}.linux-amd64 /data0/prometheus/node_exporter

chown -R prometheus.prometheus /data0/prometheus
2、创建node_exporter.service的 systemd unit 文件
- centos下创建服务
cat > /usr/lib/systemd/system/node_exporter.service <<EOF
[Unit]
Description=node_exporter
Documentation=https://prometheus.io/
After=network.target

[Service]
Type=simple
User=prometheus
ExecStart=/data0/prometheus/node_exporter/node_exporter
Restart=on-failure

[Install]
WantedBy=multi-user.target
EOF- ubuntu下创建服务
cat > /etc/systemd/system/node_exporter.service <<EOF
[Unit]
Description=node_exporter
Documentation=https://prometheus.io/
After=network.target

[Service]
Type=simple
User=prometheus
ExecStart=/data0/prometheus/node_exporter/node_exporter
Restart=on-failure

[Install]
WantedBy=multi-user.target
EOF
3、启动服务
systemctl daemon-reload
systemctl stop node_exporter.service
systemctl enable node_exporter.service
systemctl restart node_exporter.service
4、运行状态
systemctl status node_exporter.service5、客户监控端数据汇报
访问:http://192.168.56.11:9100/metrics 查看从exporter具体能抓到的数据.如下:
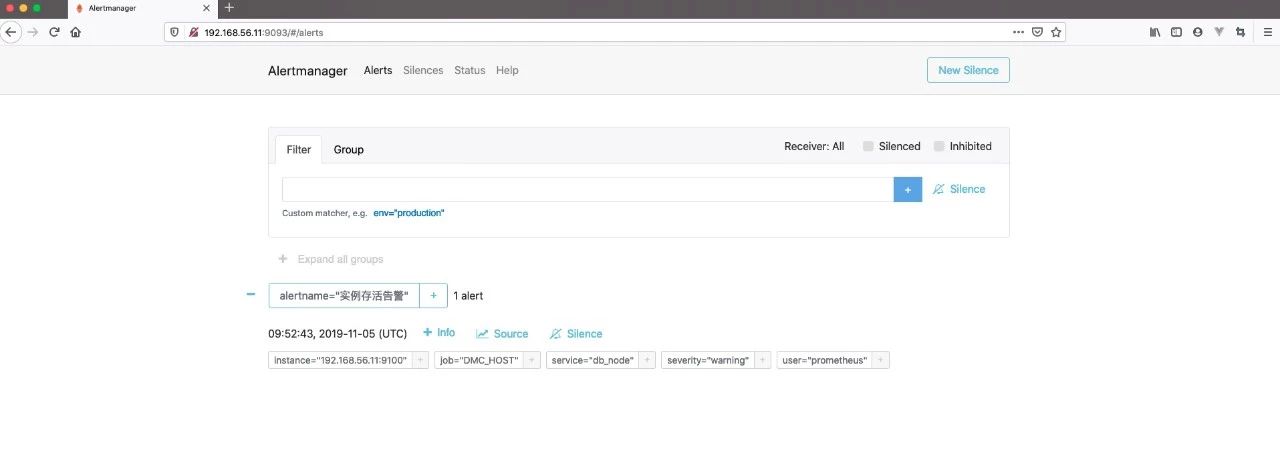
三、部署 Alertmanager 钉钉报警
1、下载及解压安装包
cd /usr/local/src/

export VER="0.19.0"
wget https://github.com/prometheus/alertmanager/releases/download/v${VER}/alertmanager-${VER}.linux-amd64.tar.gz

mkdir -p /data0/prometheus
groupadd prometheus
useradd -g prometheus prometheus -d /data0/prometheus

tar -xvf alertmanager-${VER}.linux-amd64.tar.gz
cd /usr/local/src/
mv alertmanager-${VER}.linux-amd64 /data0/prometheus/alertmanager

chown -R prometheus.prometheus /data0/prometheus
2、配置 Alertmanager
alertmanager 的 webhook 集成了钉钉报警,钉钉机器人对文件格式有严格要求,所以必须通过特定的格式转换,才能发送给你钉钉的机器人。有人已经t贴心的为大家写了转换插件,那我们也就直接拿来用吧!
( https://github.com/timonwong/prometheus-webhook-dingtalk.git )
33、启动 Alertmanager
cat >/lib/systemd/system/alertmanager.service<<EOF
[Unit]
Description=Prometheus: the alerting system
Documentation=http://prometheus.io/docs/
After=prometheus.service

[Service]
ExecStart=/data0/prometheus/alertmanager/alertmanager --config.file=/data0/prometheus/alertmanager/alertmanager.yml
Restart=always
StartLimitInterval=0
RestartSec=10

[Install]
WantedBy=multi-user.target
EOF

systemctl enable alertmanager.service
systemctl stop alertmanager.service
systemctl restart alertmanager.service
systemctl status alertmanager.service

#查看端口
netstat -anpt | grep 9093
4、将钉钉接入 Prometheus AlertManager WebHook
#- 4.1、二进制包方式部署插件
cd - 4.2、docker方式部署插件
docker pull timonwong/prometheus-webhook-dingtalk:v0.3.0

#docker run -d --restart always -p 8060:8060 timonwong/prometheus-webhook-dingtalk:v0.3.0 --ding.profile="<web-hook-name>=<dingtalk-webhook>"

docker run -d --restart always -p 8060:8060 timonwong/prometheus-webhook-dingtalk:v0.3.0 --ding.profile="ops_dingding=https://oapi.dingtalk.com/robot/send?access_token=18f977769d50518e9d4f99a0d5dc1376f05615b61ea3639a87f106459f75b5c9" --ding.profile="info_dingding=https://oapi.dingtalk.com/robot/send?access_token=11a0496d0af689d56a5861ae34dc47d9f1607aee6f342747442cc83e36715223"

这里解释一下两个变量:

<web-hook-name> :prometheus-webhook-dingtalk 支持多个钉钉 webhook,不同 webhook 就是靠名字对应到 URL 来做映射的。要支持多个钉钉 webhook,可以用多个 --ding.profile 参数的方式支持,例如:sudo docker run -d --restart always -p 8060:8060 timonwong/prometheus-webhook-dingtalk:v0.3.0 --ding.profile="webhook1=https://oapi.dingtalk.com/robot/send?access_token=token1" --ding.profile="webhook2=https://oapi.dingtalk.com/robot/send?access_token=token2"。而名字和 URL 的对应规则如下,ding.profile="webhook1=......",对应的 API URL 为:http://localhost:8060/dingtalk/webhook1/send

<dingtalk-webhook>:这个就是之前获取的钉钉 webhook- 4.3、源码方式部署插件
#安装golang环境
cd /usr/local/src/
wget https://dl.google.com/go/go1.13.4.linux-amd64.tar.gz
tar -zxvf go1.13.4.linux-amd64.tar.gz
mv go/ /usr/local/

#vim /etc/profile
export GOROOT=/usr/local/go
export PATH=$PATH:$GOROOT/bin

#添加环境变量GOPATH
mkdir -p /opt/path
export GOPATH=/opt/path

#若 $GOPATH/bin 没有加入$PATH中,你需要执行将其可执行文件移动到$GOBIN下
export GOPATH=/opt/path
export PATH=$PATH:$GOROOT/bin:$GOPATH/bin
source /etc/profile

#下载插件
cd /usr/local/src/
git clone https://github.com/timonwong/prometheus-webhook-dingtalk.git
cd prometheus-webhook-dingtalk
go get github.com/timonwong/prometheus-webhook-dingtalk/cmd/prometheus-webhook-dingtalk
make   #(make成功后,会产生一个prometheus-webhook-dingtalk二进制文件)

#将钉钉告警插件拷贝到alertmanager目录
cp prometheus-webhook-dingtalk /data0/prometheus/alertmanager/

#启动服务
nohup /data0/prometheus/alertmanager/prometheus-webhook-dingtalk/prometheus-webhook-dingtalk --ding.profile="ops_dingding=https://oapi.dingtalk.com/robot/send?access_token=18f977769d50518e9d4f99a0d5dc1376f05615b61ea3639a87f106459f75b5c9" --ding.profile="info_dingding=https://oapi.dingtalk.com/robot/send?access_token=11a0496d0af689d56a5861ae34dc47d9f1607aee6f342747442cc83e36715223" 2>&1 1>/tmp/dingding.log &

#检查端口
netstat -anpt | grep 8060
四、Grafana安装及配置
1、下载及安装
cd /usr/local/src/

export VER="6.4.3"
wget https://dl.grafana.com/oss/release/grafana-${VER}-1.x86_64.rpm
yum localinstall -y grafana-${VER}-1.x86_64.rpm
2、启动服务
systemctl daemon-reload
systemctl enable grafana-server.service
systemctl stop grafana-server.service
systemctl restart grafana-server.service
3、访问WEB界面
默认账号/密码:admin/admin http://192.168.56.11:3000
4、Grafana添加数据源
在登陆首页,点击"Configuration-Data Sources"按钮,跳转到添加数据源页面,配置如下:
Name: prometheus
Type: prometheus
URL: http://192.168.56.11:9090
Access: Server
取消Default的勾选,其余默认,点击"Add",如下:

需要安装饼图的插件
grafana-cli plugins install grafana-piechart-panel
systemctl restart grafana-server.service

请确保安装后能正常添加饼图。

安装consul数据源插件
grafana-cli plugins install sbueringer-consul-datasource
systemctl restart grafana-server.service
五、替换grafana的dashboards
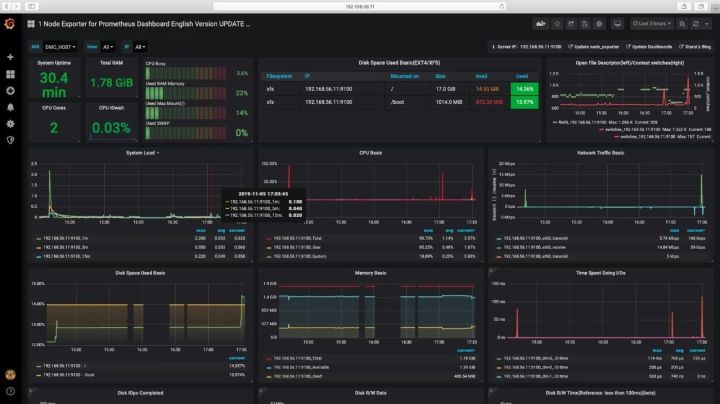
https://grafana.com/dashboards
https://grafana.com/grafana/dashboards/11074  基础监控-new

https://grafana.com/dashboards/8919   基础监控

https://grafana.com/dashboards/7362   数据库监控
参考文档:
https://www.jianshu.com/p/e59cfd15612e Centos 7 部署 Prometheus、Alertmanager、Grafana 监控 Linux 主机
https://juejin.im/entry/5c2c4a7f6fb9a049b82a90ee 使用 Prometheus 监控 Ceph
https://blog.csdn.net/xiegh2014/article/details/84936174 CentOS7.5 Prometheus2.5+Grafana5.4监控部署
https://www.cnblogs.com/smallSevens/p/7805842.html Grafana+Prometheus打造全方位立体监控系统
https://www.cnblogs.com/sfnz/p/6566951.html安装prometheus+grafana监控mysql redis kubernetes等
https://blog.csdn.net/hzs33/article/details/86553259 prometheus+grafana监控mysql、canal服务器
原创转载请申请作者同意
作者:Lancger
github 地址:https://github.com/Lancger/opslinux/blob/master/monitor/Prometheus/1.Prometheus%2BNode_exporter%2BGrafana%2BAlertmanager%E7%9B%91%E6%8E%A7%E4%B8%80%E4%BD%93%E5%8C%96.md
51Reboot 本周四 分享主题 《k8s 企业级落地实战》,免费直播课还有额外福利。(往下看)
分享内容:
容器技术介绍
k8s 生态介绍
k8s 线下环境落地实战
- 根据场景需求制定容器方案
- 定制容器服务镜像
- 配置 Jenkins slave(docker in docker)
- k8s 接入 wayne 管理平台
直播时间:2019.11.07 21:00-22:00
主讲师:LZ
曾就职于 58,有 7 年一线资深 SRE 经验,维护万台以上规模的架构,对 Docker、Kubernetes、微服务以及 Service Mesh 落地实践有着丰富的经验。现核心负责Docker 和 Kubernetes 容器化和平台建设方面的工作,在企业容器化中有深入的感悟和体验。

看“福利”(可不参加)
获取福利方式:以上《K8S 企业级落地实战》海报 分享朋友圈,集赞66即可免费获得《Gopher Meetup》技术分享会入场票一张,仅限前10名。
报名 Golang 课程送《Gopher Meetup》技术分享会入场票一张,截止到11.17号之前。


 3735
3735

 被折叠的 条评论
为什么被折叠?
被折叠的 条评论
为什么被折叠?
 到【灌水乐园】发言


