


图形是呈现数据的一种直观方式,在用Matlab进行数据处理和计算后,我们一般都会以图形的形式将结果呈现出来。尤其在论文的撰写中,优雅的图形无疑会为文章加分。本篇文章非完全原创,我的工作就是把见到的Matlab绘图代码收集起来重新跑一遍,修改局部错误,然后将所有的图贴上来供大家参考。大家可以先看图,有看中的可以直接把代码Copy过去改成自己想要的。
%% 直方图图的绘制
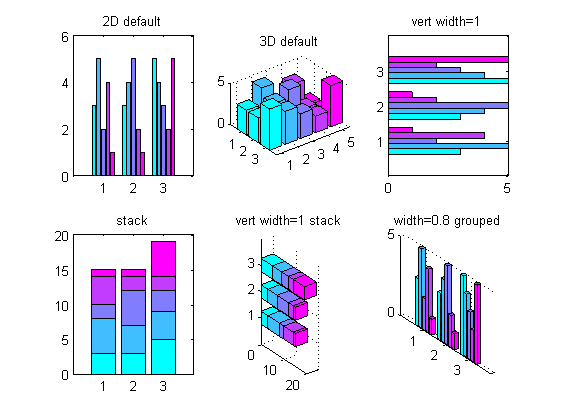
%直方图有两种图型:垂直直方图和水平直方图。而每种图型又有两种表现模式:累计式:分组式。
figure;
z=[3,5,2,4,1;3,4,5,2,1;5,4,3,2,5]; % 各因素的相对贡献份额
colormap(cool);% 控制图的用色
subplot(2,3,1);
bar(z);%二维分组式直方图,默认的为'group'
title('2D default');
subplot(2,3,2);
bar3(z);%三维的分组式直方图
title('3D default');
subplot(2,3,3);
barh(z,1);%分组式水平直方图,宽度设置为1
title('vert width=1');
subplot(2,3,4);
bar(z,'stack');%累计式直方图,例如:1,1+2,1+2+3构成了第一个bar
title('stack')
subplot(2,3,5);
bar3h(z,0.5,'stacked');%三维累计式水平直方图
title('vert width=1 stack');
subplot(2,3,6);
bar3(z,0.8,'grouped');%对相关数据的颜色进行分组,默认的位'group'
title('width=0.8 grouped');
%% =========柱状图的进阶==========
figure;
y=[300 311;390 425; 312 321; 250 185; 550 535; 420 432; 410 520;];
subplot(1,3,1);
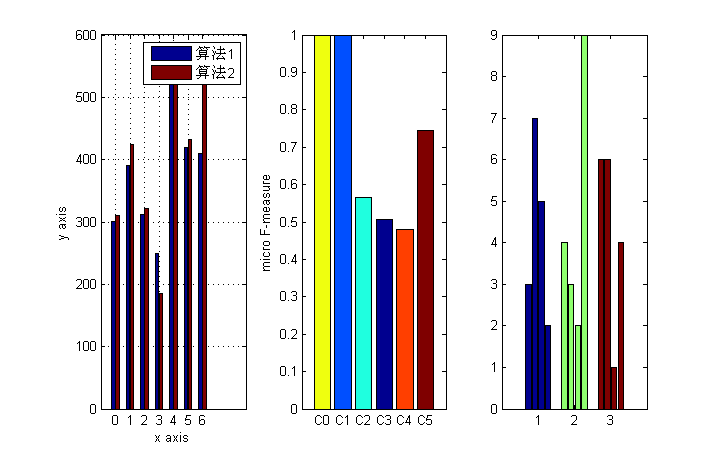
b=bar(y);
grid on;
set(gca,'XTickLabel',{'0','1','2','3','4','5','6'})
legend('算法1','算法2');
xlabel('x axis');
ylabel('y axis');
%使仅有的一组柱状图呈现不同颜色,默认的位相同颜色
data = [1.0, 1.0, 0.565, 0.508, 0.481, 0.745];
subplot(1,3,2);
b = bar(data);
ch = get(b,'children');
set(ch,'FaceVertexCData',[4;2;3;1;5;6]);%使用Indexed形式指定每组bar的颜色
set(gca,'XTickLabel',{'C0','C1','C2','C3','C4','C5'})
axis([0 7 0.0 1.0]);
ylabel('micro F-measure');
%使每个bar颜色不同,默认的是每个元素在不同组的颜色相同
data = [3, 7, 5, 2;4, 3, 2, 9;6, 6, 1, 4];
subplot(1,3,3);
b = bar(data);
ch = get(b,'children');
set(ch{1},'FaceVertexCData',[1;2;3]);%设置第一个元素在不同组的颜色
set(ch{2},'FaceVertexCData',[1;2;3]);%设置第二个元素在不同组的颜色
set(ch{3},'FaceVertexCData',[1;2;3]);
set(ch{4},'FaceVertexCData',[1;2;3]);
%% 彩色柱状图
%用到的数据
n = 8;
Z = rand(n,1);
figure;
%默认图片
subplot(1,3,1);
bar(Z);
%简单的作图
% 这个图根据数据列中值的大小着色。每列中的值越大,颜色越突出
subplot(1,3,2);
h=bar(Z);
colormap(summer(n));
ch = get(h,'Children');
fvd = get(ch,'Faces');%针对矩阵时,只能用fvd=get(ch{col},'Faces'),下同
fvcd = get(ch,'FaceVertexCData');
[~, izs] = sortrows(Z,1);
for i = 1:n
row = izs(i);
fvcd(fvd(row,:)) = i;
end
set(ch,'FaceVertexCData',fvcd)
%图片会以渐变的方式着色,效果非常不错
subplot(1,3,3);
h=bar(Z);
ch = get(h,'Children');
fvd = get(ch,'Faces');
fvcd = get(ch,'FaceVertexCData');
[zs, izs] = sortrows(Z,1);
k = 128; % 准备生成128 *3 行的colormap
colormap(summer(k)); % 这样会产生一个128 * 3的矩阵,分别代表[R G B]的值
% 检视数据
whos ch fvd fvcd zs izs
% Name Size Bytes Class Attributes
%
% ch 1x1 8 double
% fvcd 66x1 528 double
% fvd 13x4 416 double
% izs 13x1 104 double
% zs 13x1 104 double
%
shading interp % Needed to graduate colors
for i = 1:n
color = floor(k*i/n); % 这里用取整函数获得color在colormap中行
row = izs(i); % Look up actual row # in data
fvcd(fvd(row,1)) = 1; % Color base vertices 1st index
fvcd(fvd(row,4)) = 1;
fvcd(fvd(row,2)) = color; % Assign top vertices color
fvcd(fvd(row,3)) = color;
end
set(ch,'FaceVertexCDat
 最低0.47元/天 解锁文章


 4796
4796


 被折叠的 条评论
为什么被折叠?
被折叠的 条评论
为什么被折叠?
 到【灌水乐园】发言


