


1,GC log
通过配置可以查看gc日志。tomcat.gc.log
Major GC
2019-10-12T18:20:08.224+0800: 2.287: [GC (Allocation Failure) [PSYoungGen: 524800K->29911K(611840K)] 524800K->30015K(2010112K), 0.0896057 secs] [Times: user=1.40 sys=0.23, real=0.09 secs]
方括号内部:[PSYoungGen: 524800K->29911K(611840K)]表示:
221627K->0K(465920K) 表示:GC前该内存区域已使用容量->GC后该内存区域已使用容量(该内存区域的总容量)。
方括号外部:524800K->30015K(2010112K), 0.0896057 secs表示:
GC前Java堆已使用容量->GC后Java堆已使用容量,后面圆括号里面的125952K为Java堆总容量。 PSYoungGen耗时。
最后面的[Times: user=1.40 sys=0.23, real=0.09 secs]表示:
用户消耗的CPU时间 内核态消耗的CPU时间 操作从开始到结束所经过的墙钟时间(Wall Clock Time)。
real是整个过程实际花费的时间。user+sys是CPU时间,每个CPU core单独计算,所以这个时间可能会是real的好几倍。
CPU时间和墙钟时间的差别是,墙钟时间包括各种非运算的等待耗时,例如等待磁盘I/O、等待线程阻塞,而CPU时间不包括这些耗时。
Full GC
2019-10-12T19:07:45.475+0800: 2859.539: [Full GC (Ergonomics) [PSYoungGen: 221627K->0K(465920K)] [ParOldGen: 1146078K->1352631K(1398272K)] 1367705K->1352631K(1864192K), [Metaspace: 102828K->102351K(1142784K)], 5.0675678 secs] [Times: user=122.35 sys=2.36, real=5.06 secs]
PSYoungGen
表示新生代,这个名称由收集器决定。PS是Parallel Scavenge收集器的缩写,它配套的新生代称为PSYoungGen。
ParOldGen
Parallel Scavenge收集器配套的老年代。
Metaspace
Parallel Scavenge收集器配套的永久代。
Heap
Heap
PSYoungGen total 465920K, used 121214K [0x00000000d5580000, 0x0000000100000000, 0x0000000100000000)
eden space 232960K, 52% used [0x00000000d5580000,0x00000000dcbdf9e0,0x00000000e3900000)
from space 232960K, 0% used [0x00000000e3900000,0x00000000e3900000,0x00000000f1c80000)
to space 232960K, 0% used [0x00000000f1c80000,0x00000000f1c80000,0x0000000100000000)
ParOldGen total 1398272K, used 357409K [0x0000000080000000, 0x00000000d5580000, 0x00000000d5580000)
object space 1398272K, 25% used [0x0000000080000000,0x0000000095d084d8,0x00000000d5580000)
Metaspace used 102915K, capacity 106894K, committed 107648K, reserved 1142784K
class space used 13164K, capacity 13819K, committed 13952K, reserved 1048576K
total
总的空间。
used
用掉的空间。
PSYoungGen
新生代又分化eden space、from space和to space这三部分。
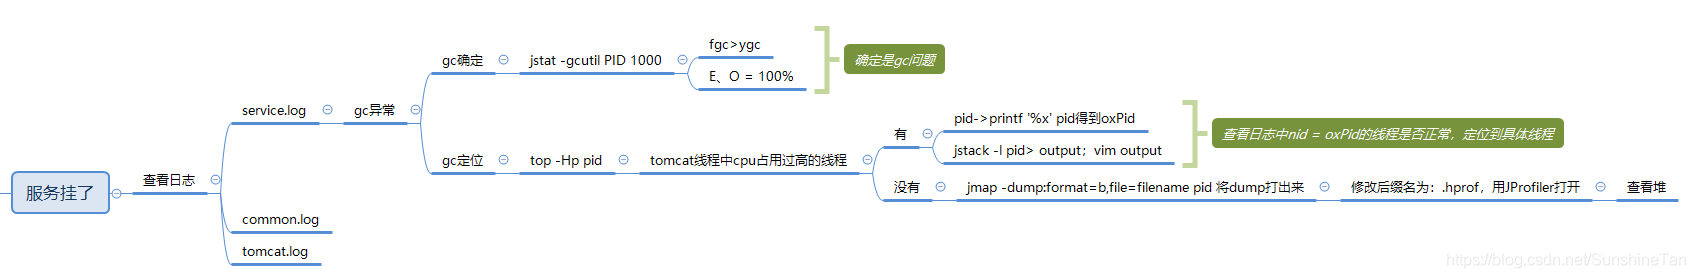
2,gc排查思路


 2495
2495


 被折叠的 条评论
为什么被折叠?
被折叠的 条评论
为什么被折叠?
 到【灌水乐园】发言


