


 本文详细介绍如何在Linux系统中检查和管理Swap空间,包括使用多种命令如swapon、free、vmstat等来查看Swap使用情况,以及通过smem命令深入分析进程的Swap使用详情。
How To Check Swap Usage Size and Utilization in Linux
ow do I check swap (paging) usage under Linux operating systems using command bash/ksh line options? How do I check swap usage size on Linux operating system?
Swap space (also known as paging) is nothing but computer memory management involving swapping regions of memory to and from storage. You can see swap usage summary by device using any one of the following commands. You may have to login as root user to use the following commands. The maximum useful size of a swap area depends on the architecture and the kernel version. For Linux kernels after v2.3.3+ there is no such limitation on swap size.
Check swap usage size and utilization in Linux
The procedure to check swap space usage and size in Linux is as follows:
- Open a terminal application.
- To see swap size in Linux, type the command: swapon -s.
- You can also refer to the /proc/swaps file to see swap areas in use on Linux.
- Type free -m to see both your ram and your swap space usage in Linux.
- Finally, one can use the top or htop command to look for swap space Utilization on Linux too.
How to Check Swap Space in Linux using /proc/swaps file
Type the following cat command to see total and used swap size:# cat /proc/swaps
Sample outputs:
Filename				Type		Size	Used	Priority
/dev/sda3                               partition	6291448	65680	0
Another option is to type the grep command as follows:grep Swap /proc/meminfo
SwapCached:            0 kB
SwapTotal:        524284 kB
SwapFree:         524284 kB
Look for swap space in Linux using swapon command
Type the following command to show swap usage summary by device# swapon -s
Sample outputs:
Filename				Type		Size	Used	Priority
/dev/sda3                               partition	6291448	65680	0
Use free command to monitor swap space usage
Use the free command as follows:# free -g
# free -k
# free -m
Sample outputs:
             total       used       free     shared    buffers     cached
Mem:         11909      11645        264          0        324       8980
-/+ buffers/cache:       2341       9568
Swap:         6143         64       6079
See swap size in Linux using vmstat command
Type the following vmstat command:# vmstat
# vmstat 1 5
Sample outputs:
procs -----------memory---------- ---swap-- -----io---- -system-- ----cpu----
 r  b   swpd   free   buff  cache   si   so    bi    bo   in   cs us sy id wa
 1  9 1209512 101352   1504 127980    0    3    11    20   60   55  3  1 95  1
 2 11 1209640 101292   1508 134132  844  424  5608   964 23280 15012  2  8 20 70
 0 10 1210052 108132   1532 125764  648  660 10548   916 22237 18103  3 10 11 77
 1 13 1209892 106484   1500 128052  796  240 10484   980 24024 12692  2  8 24 67
 1  9 1209332 113412   1500 124028 1608  168  2472   620 28854 13761  2  8 20 70
Note down the following output from swap field:
- si: Amount of memory swapped in from disk (/s).
- so: Amount of memory swapped to disk (/s).
top/atop/htop/glances command
Type the following commands:# atop
# htop
# top
# glances
Sample outputs from top command:
top - 02:54:24 up 15:24,  4 users,  load average: 0.45, 4.84, 6.75
Tasks: 266 total,   1 running, 264 sleeping,   0 stopped,   1 zombie
Cpu(s):  3.2%us,  1.4%sy,  0.0%ni, 94.4%id,  1.0%wa,  0.0%hi,  0.1%si,  0.0%st
Mem:   8120568k total,  7673584k used,   446984k free,     4516k buffers
Swap: 15859708k total,  1167408k used, 14692300k free,  1151972k cached

  PID USER      PR  NI  VIRT  RES  SHR S %CPU %MEM    TIME+  COMMAND
13491 vivek     20   0 1137m 279m 6692 S   10  3.5  19:17.47 firefox
 5663 vivek     10 -10 1564m 1.1g  59m S    8 14.5   5:10.94 vmware-vmx
 2661 root      20   0  352m 185m 8604 S    6  2.3  65:40.17 Xorg
 3752 vivek     20   0 3566m 2.6g  12m S    6 33.6  63:44.35 compiz
 4798 vivek     20   0  900m  50m 4992 S    2  0.6   0:11.04 chrome
 5539 vivek     20   0 1388m 838m 780m S    2 10.6   1:45.78 VirtualBox
 6297 root      20   0     0    0    0 S    2  0.0   0:00.15 kworker/2:0
 6646 root      20   0 19252 1404  936 R    2  0.0   0:00.01 top
    1 root      20   0  8404  644  608 S    0  0.0   0:03.32 init
    2 root      20   0     0    0    0 S    0  0.0   0:00.03 kthreadd
    3 root      20   0     0    0    0 S    0  0.0   0:02.30 ksoftirqd/0
    6 root      RT   0     0    0    0 S    0  0.0   0:00.00 migration/0
    7 root      RT   0     0    0    0 S    0  0.0   0:00.24 watchdog/0
   37 root       0 -20     0    0    0 S    0  0.0   0:00.00 cpuset
   38 root       0 -20     0    0    0 S    0  0.0   0:00.00 khelper
   39 root      20   0     0    0    0 S    0  0.0   0:00.00 kdevtmpfs
   40 root       0 -20     0    0    0 S    0  0.0   0:00.00 netns
Sample outputs from htop command:
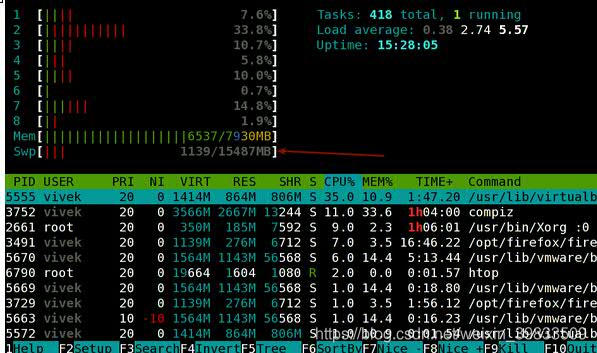
Fig.01: Linux: Swap Memory Usage Command
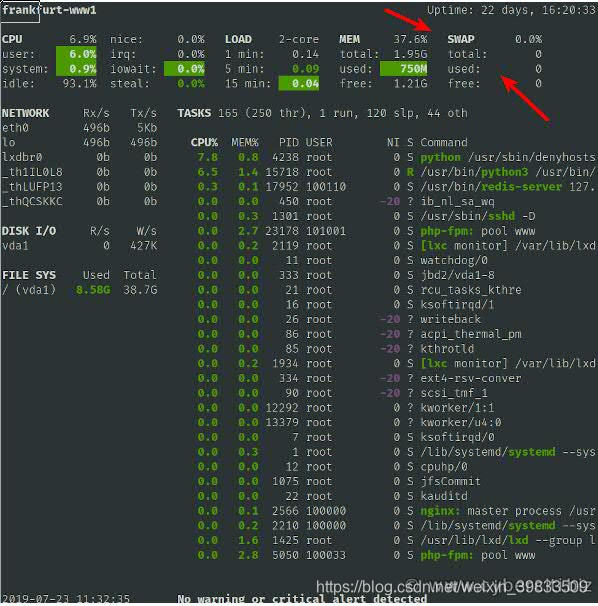
Sample outputs from glances command:
Linux Find Out What Process Are Using Swap Space
Try smem command:smem
ORtop
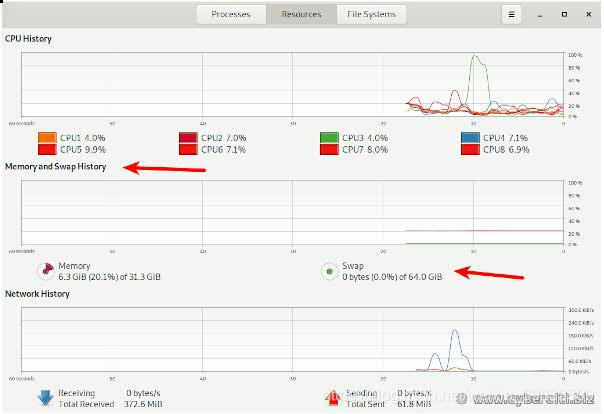
inux GUI tool to monitor swap space size and usage
Try Gnome or KDE system monitor tool. For example, the GNOME System Monitor shows you what programs are running and how much processor time, memory (including paging/swap space size), and disk space are being used.
Conclusion
This page showed you how to check for swap space size and utilization in Linux. If you see a large percentage of the swap space utilization, then it is time to add more physical RAM to the Linux system. Another option is to increase swap space by adding a swap file on Linux. Please see the following resources for more info:
- Linux: Should You Use Twice the Amount of Ram as Swap Space?
- See man pages – for more information.
- Swap/Paging facts and questions by Ubuntu wiki
the following awk command (number #3):# awk '/VmSwap/{print $2 " " $3}' /proc/48440/status
Sample outputs (number #4):
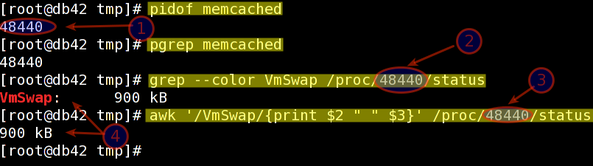
Fig.01: Finding out memcached process swap usage on Linux
Listing all process swap space usage
Type the following bash for loop command to see swap space usage per process:
## bash for loop ##
for file in /proc/*/status ; do awk '/VmSwap|Name/{printf $2 " " $3}END{ print ""}' $file; done |
Type the following command to sort out output:
## Get swap space in Linux using bash for loop ##
for file in /proc/*/status ; do awk '/VmSwap|Name/{printf $2 " " $3}END{ print ""}' $file; done | sort -k 2 -n -r | less |
Sample outputs:
php-cgi 11964 kB
php-cgi 11016 kB
php-cgi 10392 kB
php-cgi 10336 kB
php-cgi 9844 kB
php-cgi 9780 kB
php-cgi 8584 kB
php-cgi 7996 kB
php-cgi 7960 kB
php-cgi 7956 kB
php-cgi 7796 kB
php-cgi 7540 kB
php-cgi 3604 kB
rpc.mountd 3580 kB
....
..
Say hello to smem
The smem command reports physical memory usage, taking shared memory pages into account. Unshared memory is reported as the USS (Unique Set Size). Shared memory is divided evenly among the processes sharing that memory. The unshared memory (USS) plus a process’s proportion of shared memory is reported as the PSS (Proportional Set Size). The USS and PSS only include physical memory usage. They do not include memory that has been swapped out to disk. Memory can be reported by process, by user, by mapping, or system-wide. Both text mode and graphical output are available.
Installation
To install smem[2] type the following command under Debian / Ubuntu Linux:$ sudo apt-get install smem
RHEL / CentOS Linux user type the following command:$ wget https://www.selenic.com/smem/download/smem-1.4.tar.gz
$ tar xvf smem-1.4.tar.gz
# cp /tmp/smem-1.2/smem /usr/local/bin/
# chmod +x /usr/local/bin/smem
How do I use smem command?
The syntax is:
smem [option]

## This lets smem include the size of the kernel's code and statically allocated data in the systemwide (-w) output ##
smem -K /path/to/kernel/image/on/disk [option]

## Amount of physical RAM.  This lets smem detect the amount of memory used by firmware/hardware in the systemwide (-w) output.
## If  provided, it will also be used as the total memory size to base percentages on.
smem -R REALMEMSIZE [option]
To see basic process information, enter:# smem
Sample outputs:
  PID User     Command                         Swap      USS      PSS      RSS
53369 xxxxxxx  /usr/bin/php-cgi                2788        0        0        8
53387 xxxxxxx  /usr/bin/php-cgi                2796        0        0        8
36227 xxxxxxx  /usr/bin/php-cgi                2324        0        1        8
36232 xxxxxxx  /usr/bin/php-cgi                2324        0        1        4
36233 xxxxxxx  /usr/bin/php-cgi                2324        0        1        4
46733 xxxxxxx  /usr/bin/php-cgi                2904        0        2        8
46739 xxxxxxxx /usr/bin/php-cgi                2904        0        2        4
 3623 root     ssh-agent                        576        4        4        4
53378 xxxxxxx  /usr/bin/php-cgi                2788        4        4        8
53396 vivek    /usr/bin/php-cgi                2788        4        4        8
 7855 root     rpc.rquotad                      144        4        6      116
 7480 root     ssh-agent                        604        4        7      112
34832 root     ssh-agent                        576        4        7       92
 7334 root     /sbin/mingetty /dev/tty1          76        4       19      436
 7336 root     /sbin/mingetty /dev/tty2          76        4       19      436
 7338 root     /sbin/mingetty /dev/tty3          76        4       19      436
 7340 root     /sbin/mingetty /dev/tty4          80        4       19      436
 7346 root     /sbin/mingetty /dev/tty5          80        4       19      436
 7350 root     /sbin/mingetty /dev/tty6          76        4       19      436
 7332 root     /sbin/agetty /dev/ttyS1 192       80        4       22      460
53405 raj      /usr/bin/php-cgi                2760       32       32       36
 7780 rpcuser  rpc.statd                       3568        4       41      668
To see library-oriented view, enter:# smem -m
To see user-oriented view, enter:# smem -u
Sample outputs:
User     Count     Swap      USS      PSS      RSS
rpcuser      1     3568        4       41      668
vivek        4     7300       44       73      564
xxxxxxxx     3     6120       56       77      524
rpc          1      200       68      104      596
raj          1      468      272      300      892
ntp          1      316      324      367     1036
cdnnginx     1      420      572      603     1216
To see systemwide memory usage summary pass the -w option:# smem -w
Sample outputs:
Area                           Used      Cache   Noncache
firmware/hardware                 0          0          0
kernel image                      0          0          0
kernel dynamic memory       5302144    5137920     164224
userspace memory            2692196     240828    2451368
free memory                  126228     126228          0
To see system view# smem -R 8G -K /path/to/vmlinux/on/disk -w
To see totals and percentages, enter:# smem -t -p
Sample outputs:
  PID User     Command                         Swap      USS      PSS      RSS
53369 xxxxxxx  /usr/bin/php-cgi               0.04%    0.00%    0.00%    0.00%
53387 xxxxxxx  /usr/bin/php-cgi               0.04%    0.00%    0.00%    0.00%
36227 xxxxxxx  /usr/bin/php-cgi               0.04%    0.00%    0.00%    0.00%
36232 xxxxxxx  /usr/bin/php-cgi               0.04%    0.00%    0.00%    0.00%
36233 xxxxxxx  /usr/bin/php-cgi               0.04%    0.00%    0.00%    0.00%
46733 xxxxxxxy /usr/bin/php-cgi               0.05%    0.00%    0.00%    0.00%
46739 xxxxxxxy /usr/bin/php-cgi               0.05%    0.00%    0.00%    0.00%
 3623 root     ssh-agent                      0.01%    0.00%    0.00%    0.00%
53378 xxxxxxx  /usr/bin/php-cgi               0.04%    0.00%    0.00%    0.00%
53396 xxxxxxx  /usr/bin/php-cgi               0.04%    0.00%    0.00%    0.00%
 7855 root     rpc.rquotad                    0.00%    0.00%    0.00%    0.00%
 7480 root     ssh-agent                      0.01%    0.00%    0.00%    0.00%
34832 root     ssh-agent                      0.01%    0.00%    0.00%    0.00%
 7334 root     /sbin/mingetty /dev/tty1       0.00%    0.00%    0.00%    0.00%
 7336 root     /sbin/mingetty /dev/tty2       0.00%    0.00%    0.00%    0.00%
 7338 root     /sbin/mingetty /dev/tty3       0.00%    0.00%    0.00%    0.00%
.....
..
...
65304 vivek    /usr/bin/php-cgi               0.00%    0.16%    0.27%    0.61%
33931 vivek    /usr/bin/php-cgi               0.00%    0.14%    0.28%    0.44%
47933 squid    (squid) -f /etc/squid/squid    0.11%    2.69%    2.69%    2.71%
28410 mysql    /usr/libexec/mysqld --based    0.01%    3.67%    3.67%    3.68%
48440 memcached memcached -d -p 11211 -u me    0.01%    4.41%    4.41%    4.41%
-------------------------------------------------------------------------------
  191 24                                      5.36%   16.08%   19.43%   27.24%
Options
Type the following command to see all other supported options:# smem --help
Sample outputs:
  -h, --help            show this help message and exit
  -H, --no-header       disable header line
  -c COLUMNS, --columns=COLUMNS
                        columns to show
  -t, --totals          show totals
  -R REALMEM, --realmem=REALMEM
                        amount of physical RAM
  -K KERNEL, --kernel=KERNEL
                        path to kernel image
  -m, --mappings        show mappings
  -u, --users           show users
  -w, --system          show whole system
  -P PROCESSFILTER, --processfilter=PROCESSFILTER
                        process filter regex
  -M MAPFILTER, --mapfilter=MAPFILTER
                        map filter regex
  -U USERFILTER, --userfilter=USERFILTER
                        user filter regex
  -n, --numeric         numeric output
  -s SORT, --sort=SORT  field to sort on
  -r, --reverse         reverse sort
  -p, --percent         show percentage
  -k, --abbreviate      show unit suffixes
  --pie=PIE             show pie graph
  --bar=BAR             show bar graph
  -S SOURCE, --source=SOURCE
                        /proc data source
A note about top command
Type the top command as root:# top
To sort process as per swap page usage (SWAP = VIRT – RES) type capital O (option) followed by p (small p) and [Enter] key:
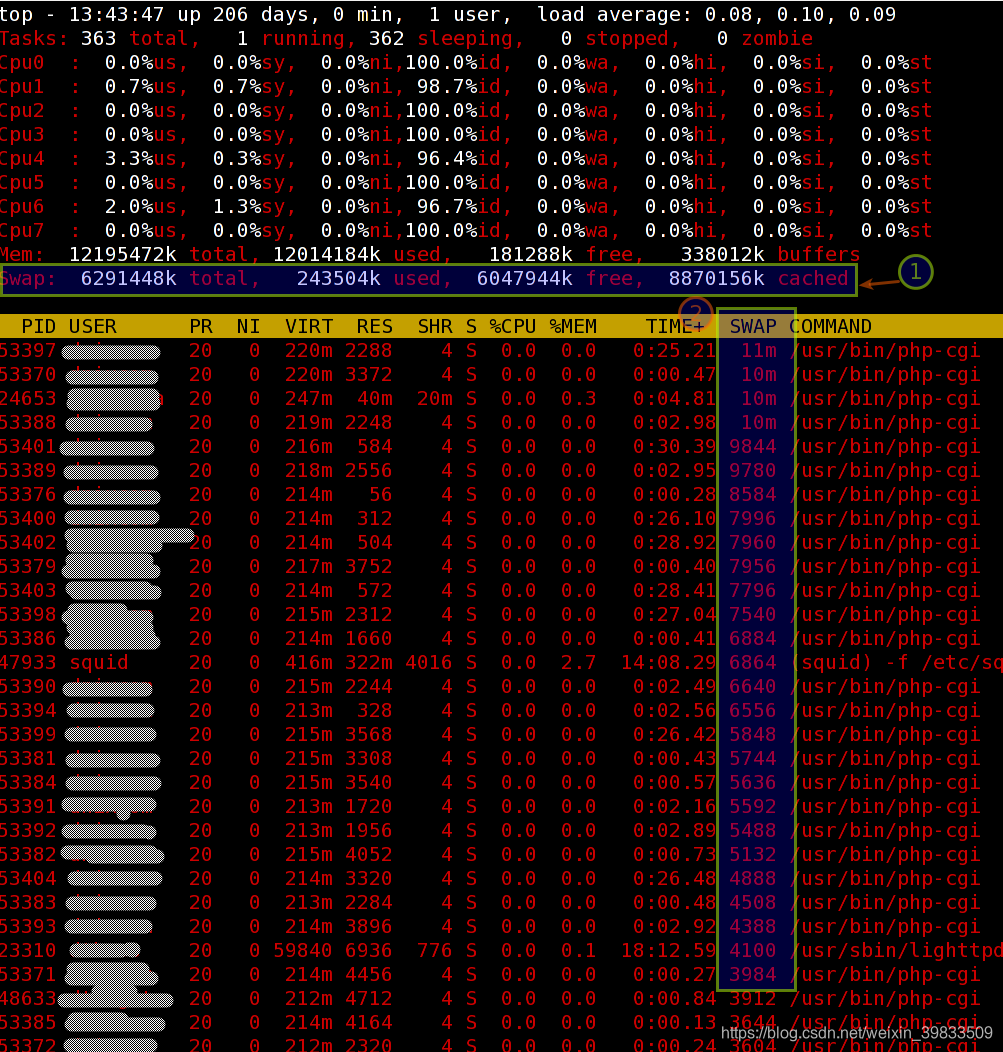
Fig.02 top command – sored process by swap usage (click to enlarge)
References:
- ^ From the htop faq page:
It is not possible to get the exact size of used swap space of a process. The top command fakes this information by making SWAP = VIRT – RES, but that is not a good metric, because other stuff such as video memory counts on VIRT as well (for example: top says my X process is using 81M of swap, but it also reports my system as a whole is using only 2M of swap. Therefore, I will not add a similar Swap column to htop because I don’t know a reliable way to get this information (actually, I don’t think it’s possible to get an exact number, because of shared pages).
- ^ smem memory reporting tool can be downloaded by visiting this page.
- man pages: top, free, htop, vmstat, smem, and proc(5)


 926
926

 被折叠的 条评论
为什么被折叠?
被折叠的 条评论
为什么被折叠?
 到【灌水乐园】发言


