


Gnuplot科学绘图
系列内容
Gnuplot科学绘图(十一)——Gnuplot 的坐标系统及标签
Gnuplot科学绘图(十二)——箭头
Gnuplot科学绘图(十三)——边框和坐标轴
Gnuplot科学绘图(十四)——图例
Gnuplot科学绘图(十五)——对数坐标
Gnuplot科学绘图(十六)——图像尺寸
gnuplot> set parametric 然后我们会看见返回信息:
dummy variable is t for curves, u/v for surfaces 和极坐标类似,参数方程的自变量也是 t。后面的 u/v 是用于 3D 绘图的参数方程自变量,我们目前暂时不管它。
对于参数方程 x = f(t), y = g(t),绘图命令为
plot f(t),g(t) 下面我们看一个例子,这是一个李萨如(Lissajous)曲线: gnuplot> set parametric
gnuplot> set xrange [-1.2:1.2]
gnuplot> set yrange [-1.2:1.2]
gnuplot> set trange [0:2*pi]
gnuplot> set samples 1000
gnuplot> set size square
gnuplot> unset key
gnuplot> plot sin(3*t),sin(4*t) lw 2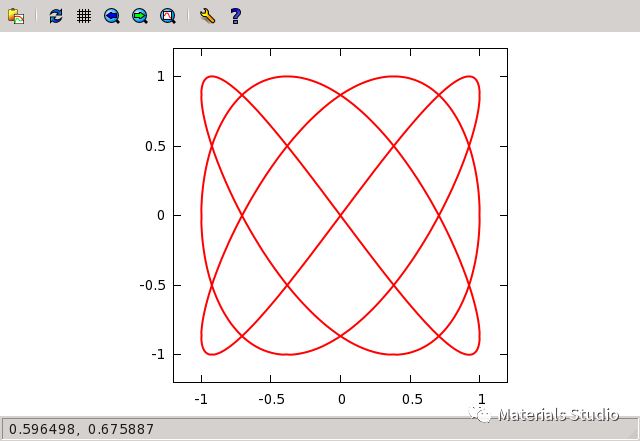 本文整理自马欢老师科学网博客,特此感谢原作者的分享。
Materials Studio系列内容中科大 Materials Studio 培训快速入门教程(包你学会!)精选众多论坛讨论贴,Materials-Studio 论坛问答全集怎样把Materials studio能带图做得漂亮,用Matlab绘制呀!Materials Studio手把手教程丨界面操作、应用与NaCl晶体构建实例怎么利用Materials Studio建立晶体模型?就是这么简单!手把手教你用Materials Studio计算碳纳米管的能带结构基于Materials Studio的异质结构建模技巧如何分析第一原理计算结果:电荷密度图、能带结构、态密度的分析70张图,搞定能带理论基础!【长篇图文,包教包会】Materials Studio软件——CASTEP使用教程详解Gnuplot科学绘图(一)——从安装到简单函数绘图(文末有彩蛋)Gnuplot科学绘图(二)——坐标取值范围及刻度(文末有彩蛋)Gnuplot科学绘图(三)——点线风格Gnuplot科学绘图(四)——多组数据绘图Gnuplot科学绘图(五)——输出eps 图片Gnuplot科学绘图(六)——输出pdf 和png 图片Gnuplot科学绘图(七)——Enhanced 文本模式Gnuplot科学绘图(八)——插入LATEX 公式Gnuplot科学绘图(九)——栅格以及方程数值解估算Gnuplot科学绘图(十)——第二坐标轴Gnuplot科学绘图(十一)——Gnuplot 的坐标系统及标签Gnuplot科学绘图(十二)——箭头Gnuplot科学绘图(十三)——边框和坐标轴Gnuplot科学绘图(十四)——图例
Gnuplot科学绘图(十五)——对数坐标
Gnuplot科学绘图(十六)——图像尺寸
Gnuplot科学绘图(十七)——极坐标
本文整理自马欢老师科学网博客,特此感谢原作者的分享。
Materials Studio系列内容中科大 Materials Studio 培训快速入门教程(包你学会!)精选众多论坛讨论贴,Materials-Studio 论坛问答全集怎样把Materials studio能带图做得漂亮,用Matlab绘制呀!Materials Studio手把手教程丨界面操作、应用与NaCl晶体构建实例怎么利用Materials Studio建立晶体模型?就是这么简单!手把手教你用Materials Studio计算碳纳米管的能带结构基于Materials Studio的异质结构建模技巧如何分析第一原理计算结果:电荷密度图、能带结构、态密度的分析70张图,搞定能带理论基础!【长篇图文,包教包会】Materials Studio软件——CASTEP使用教程详解Gnuplot科学绘图(一)——从安装到简单函数绘图(文末有彩蛋)Gnuplot科学绘图(二)——坐标取值范围及刻度(文末有彩蛋)Gnuplot科学绘图(三)——点线风格Gnuplot科学绘图(四)——多组数据绘图Gnuplot科学绘图(五)——输出eps 图片Gnuplot科学绘图(六)——输出pdf 和png 图片Gnuplot科学绘图(七)——Enhanced 文本模式Gnuplot科学绘图(八)——插入LATEX 公式Gnuplot科学绘图(九)——栅格以及方程数值解估算Gnuplot科学绘图(十)——第二坐标轴Gnuplot科学绘图(十一)——Gnuplot 的坐标系统及标签Gnuplot科学绘图(十二)——箭头Gnuplot科学绘图(十三)——边框和坐标轴Gnuplot科学绘图(十四)——图例
Gnuplot科学绘图(十五)——对数坐标
Gnuplot科学绘图(十六)——图像尺寸
Gnuplot科学绘图(十七)——极坐标
Gnuplot科学绘图(十七)——极坐标
gnuplot 也能画参数方程。首先设置参数方程环境:gnuplot> set parametric 然后我们会看见返回信息:
dummy variable is t for curves, u/v for surfaces 和极坐标类似,参数方程的自变量也是 t。后面的 u/v 是用于 3D 绘图的参数方程自变量,我们目前暂时不管它。
对于参数方程 x = f(t), y = g(t),绘图命令为
plot f(t),g(t) 下面我们看一个例子,这是一个李萨如(Lissajous)曲线: gnuplot> set parametric
gnuplot> set xrange [-1.2:1.2]
gnuplot> set yrange [-1.2:1.2]
gnuplot> set trange [0:2*pi]
gnuplot> set samples 1000
gnuplot> set size square
gnuplot> unset key
gnuplot> plot sin(3*t),sin(4*t) lw 2
本文整理自马欢老师科学网博客,特此感谢原作者的分享。
Materials Studio系列内容中科大 Materials Studio 培训快速入门教程(包你学会!)精选众多论坛讨论贴,Materials-Studio 论坛问答全集怎样把Materials studio能带图做得漂亮,用Matlab绘制呀!Materials Studio手把手教程丨界面操作、应用与NaCl晶体构建实例怎么利用Materials Studio建立晶体模型?就是这么简单!手把手教你用Materials Studio计算碳纳米管的能带结构基于Materials Studio的异质结构建模技巧如何分析第一原理计算结果:电荷密度图、能带结构、态密度的分析70张图,搞定能带理论基础!【长篇图文,包教包会】Materials Studio软件——CASTEP使用教程详解Gnuplot科学绘图(一)——从安装到简单函数绘图(文末有彩蛋)Gnuplot科学绘图(二)——坐标取值范围及刻度(文末有彩蛋)Gnuplot科学绘图(三)——点线风格Gnuplot科学绘图(四)——多组数据绘图Gnuplot科学绘图(五)——输出eps 图片Gnuplot科学绘图(六)——输出pdf 和png 图片Gnuplot科学绘图(七)——Enhanced 文本模式Gnuplot科学绘图(八)——插入LATEX 公式Gnuplot科学绘图(九)——栅格以及方程数值解估算Gnuplot科学绘图(十)——第二坐标轴Gnuplot科学绘图(十一)——Gnuplot 的坐标系统及标签Gnuplot科学绘图(十二)——箭头Gnuplot科学绘图(十三)——边框和坐标轴Gnuplot科学绘图(十四)——图例
Gnuplot科学绘图(十五)——对数坐标
Gnuplot科学绘图(十六)——图像尺寸
Gnuplot科学绘图(十七)——极坐标


 1798
1798


 被折叠的 条评论
为什么被折叠?
被折叠的 条评论
为什么被折叠?
 到【灌水乐园】发言


