


我偶然查资料看到的,不知道可不可以,用句柄图像,有点复杂,我照抄给你……其实我也不懂!不过只要你改改里面你需要画的函数,我想应该能解决你的问题
%例28-1 句柄图形对象操作
%Ex28-1 create graphics by handles
clear
clc
close all
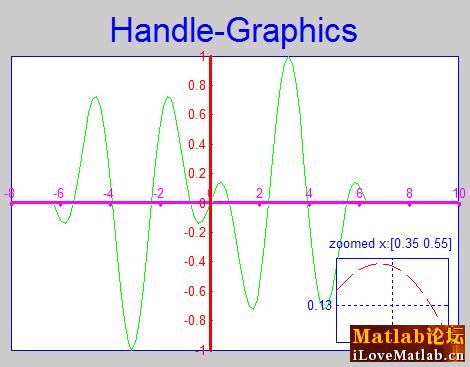
x=-2*pi:0.05*pi:2*pi;
y=sin(0.5*x).*cos(2*x);
fh=figure;
ah=axes('Parent',fh,'Layer','bottom','Position',[0.1 0.1 0.8 0.7],...
'XLim',[-8 10],'YLim',[-1 1],'XColor','b','YColor','b',...
'Box','on','XTick',[],'YTick',[]);
ahx=axes('Parent',fh,'Layer','top','Position',[0.1 0.1+0.5*0.7 0.8 eps],...
'XLim',[-8 10],'LineWidth',2.5,'XColor','m','XAxisLocation','top',...
'YColor','w','YTick',[]);
ahy=axes('Parent',fh,'Layer','top','Position',[0.1+0.8*8/18 0.1 eps 0.7],...
'YLim',[-1 1],'LineWidth',2.5,'YColor','r',...
'XColor','w','XTick',[]);
line('XData',x,'YData',y,'Parent',ah,'Color','g')
ahh=axes('Parent',fh,'Layer','top','Position',[0.68 0.12 0.2 0.2]);
set(fh,'CurrentAxes',ahh);
lh=ezplot(@(x)(sin(0.5*x).*cos(2*x)),[0.35 0.55]);
set(get(ahh,'Title'),'String','zoomed x:[0.35 0.55]','Color','b');
set(ahh,'XColor','b','YColor','b','Box','on','LineWidth',0.5,...
'XTick',[0.45],'XTickLabel','0.45','YTick',[0.13],'YTickLabel','0.13',...
'XGrid','on','YGrid','on')
set(get(ahh,'XLabel'),'String','')
set(get(ahh,'YLabel'),'String','')
set(lh,'LineStyle','--','Color','r')
set(get(ah,'Title'),'String','Handle-Graphics','FontSize',25,'Color','b')
[本帖最后由 ganliyong 于 2008-11-21 17:52 编辑]
1.jpg.jpg
(27.34 KB, 下载次数: 3646)
2008-11-21 17:50 上传


 3859
3859


 被折叠的 条评论
为什么被折叠?
被折叠的 条评论
为什么被折叠?
 到【灌水乐园】发言


