


介绍
PowerPoint在大多数商业环境中被广泛使用。本文向您展示如何使用python通过使用python自动创建PowerPoint幻灯片。

5分钟让你用Python作出最精美的Powerpoint
在前面的文章里,我们讲解了很棒的python库,用于创建和更新PowerPoint文件:。该API是非常有据可查所以它是很容易使用。唯一棘手的部分是理解PowerPoint文档结构,包括各种主布局和元素。一旦理解了基础知识,自动创建自己的PowerPoint幻灯片就相对简单了。本文将介绍使用pandas读取和分析某些Excel数据,创建表格以及构建可嵌入PowerPoint文件的图形的示例。
先来看看制作的精美PPT效果吧:
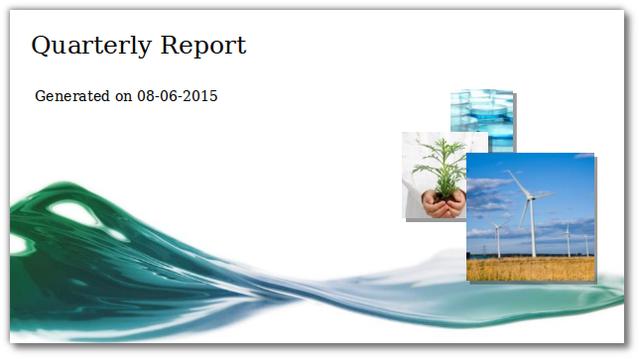
精美PPT效果1
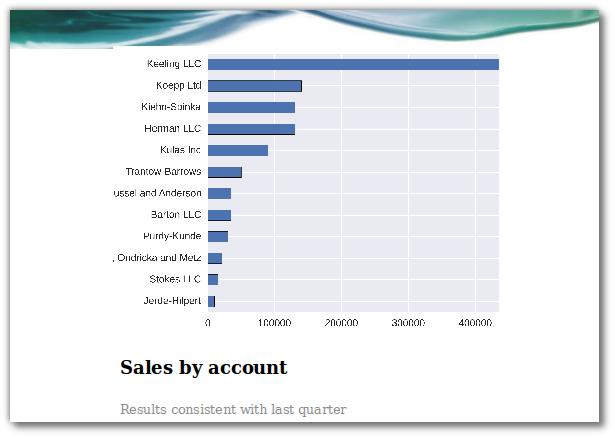
精美PPT效果2

精美PPT效果3
眼花缭乱了吧,让我们赶紧向下学习。
PowerPoint文件基础知识
Python-pptx可以创建空白的PowerPoint文件,但大多数人更愿意使用可以使用您自己的内容自定义的预定义模板。Python-pptx的API非常简单地支持这个过程,只要您了解模板的一些内容即可。
在深入研究一些代码示例之前,您需要了解两个关键组件:幻灯片布局和占位符。在下面的例子中,有两个不同布局的示例以及模板的占位符,可以在其中填充内容。
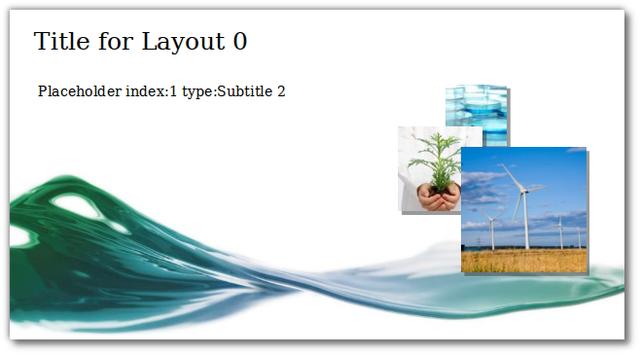
在下图中,可以看到我们正在使用布局0,并且幻灯片上的索引1处有一个占位符。
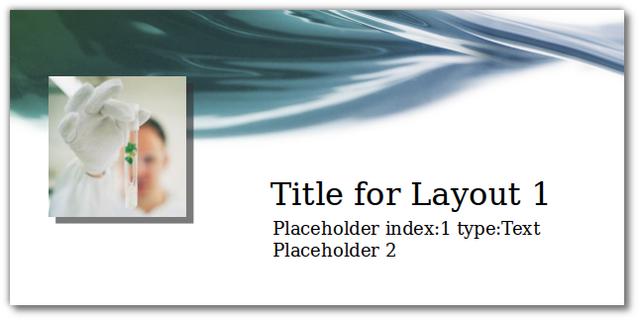
在此图像中,我们使用布局1来获得完全不同的外观。
模板让工作更轻松,创建了一个简单的独立脚本,该脚本采用模板并使用各种元素对其进行标记。
这里是程序源码,不要着急,看起来很多,但是我们下面会一一讲解。
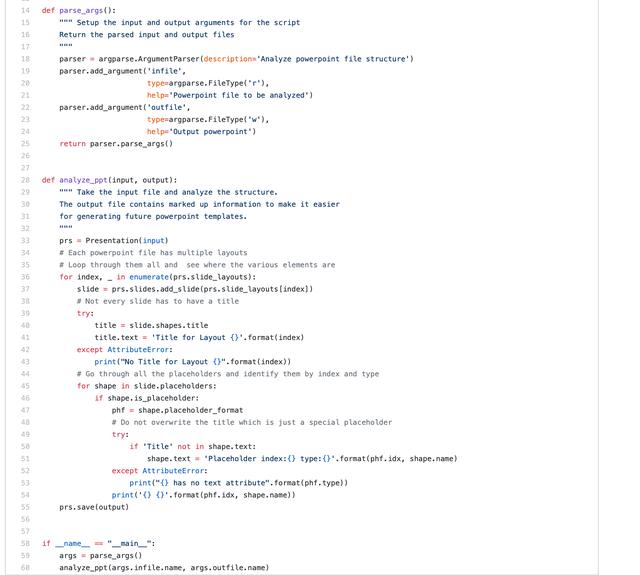
analyze_ppt.py
主要模块功能
开始讲解程序主要的功能:
def analyze_ppt(input, output): """ Take the input file and analyze the structure. The output file contains marked up information to make it easier for generating future powerpoint templates. """ prs = Presentation(input) # Each powerpoint file has multiple layouts # Loop through them all and see where the various elements are for index, _ in enumerate(prs.slide_layouts): slide = prs.slides.add_slide(prs.slide_layouts[index]) # Not every slide has to have a title try: title = slide.shapes.title title.text = 'Title for Layout {}'.format(index) except AttributeError: print("No Title for Layout {}".format(index)) # Go through all the placeholders and identify them by index and type for shape in slide.placeholders: if shape.is_placeholder: phf = shape.placeholder_format # Do not overwrite the title which is just a special placeholder try: if 'Title' not in shape.text: shape.text = 'Placeholder index:{} type:{}'.format(phf.idx, shape.name) except AttributeError: print("{} has no text attribute".format(phf.type)) print('{} {}'.format(phf.idx, shape.name)) prs.save(output)此函数的基本流程是循环并创建源PowerPoint文件中包含的每个布局的示例。然后在每张幻灯片上,它将填充标题(如果存在)。最后,它将遍历模板中包含的所有占位符,并显示占位符的索引以及类型。
如果你想自己尝试一下:
python analyze_ppt.py simple-template.ppt simple-template-markup.ppt创建自己的PowerPoint
下面不详细涉及pandas具体数据操作,因此在深入研究代码之前确保您对它有了解是有帮助的。让我们从程序的输入和基本shell开始:
from __future__ import print_functionfrom pptx import Presentationfrom pptx.util import Inchesimport argparseimport pandas as pdimport numpy as npfrom datetime import dateimport matplotlib.pyplot as pltimport seaborn as sns# Functions go hereif __name__ == "__main__": args = parse_args() df = pd.read_excel(args.report.name) report_data = create_pivot(df) create_chart(df, "report-image.png") create_ppt(args.infile.name, args.outfile.name, report_data, "report-image.png")在创建命令行args之后,将源Excel文件读入pandas DataFrame。接下来,我们使用该DataFrame作为输入来创建数据的Pivot_table摘要:def create_pivot(df, index_list=["Manager


 611
611


 被折叠的 条评论
为什么被折叠?
被折叠的 条评论
为什么被折叠?
 到【灌水乐园】发言


