


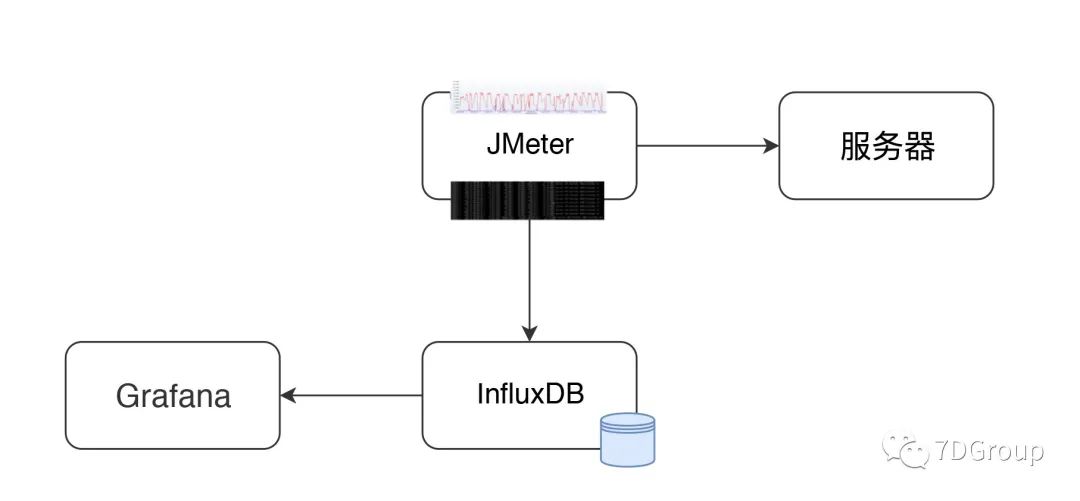
Jmeter + Grafana + InfluxDB 性能平台搭建
环境:Linux环境
centos 6
重启防火墙:service iptables rstart
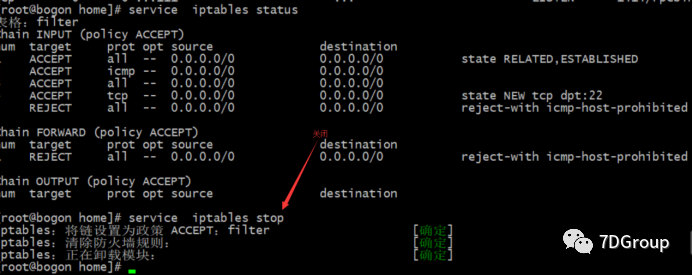
查看状态:service iptabes status
关闭防火墙:service iptables stop
关闭防火墙(重启生效):chkconfig iptables off(关闭)/on(开启)
查看自启动状态列表 chkconfig iptables --list
centos7使用如下:
关闭防火墙:systemctl stop firewalld.service
查看状态:systemctl status firewalld.service
绿的running表示防火墙开启
禁用防火墙(系统启动时不启动防火墙服务):systemctl disable firewalld
systemctl is-enabled firewalld
安装文件上传工具:
yum install -y lrzsz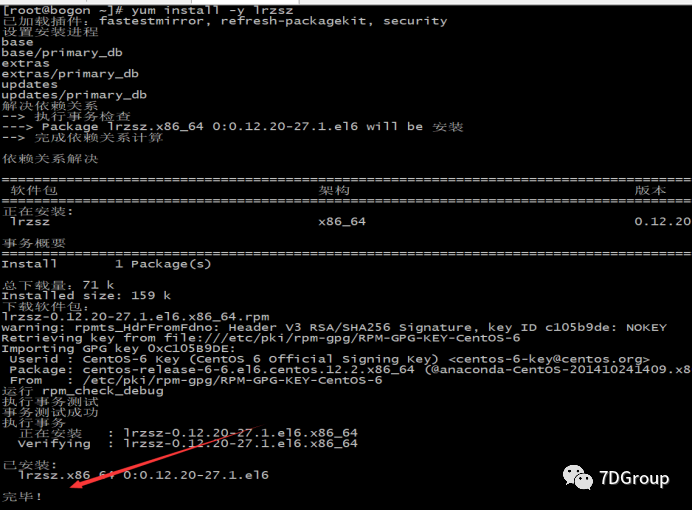
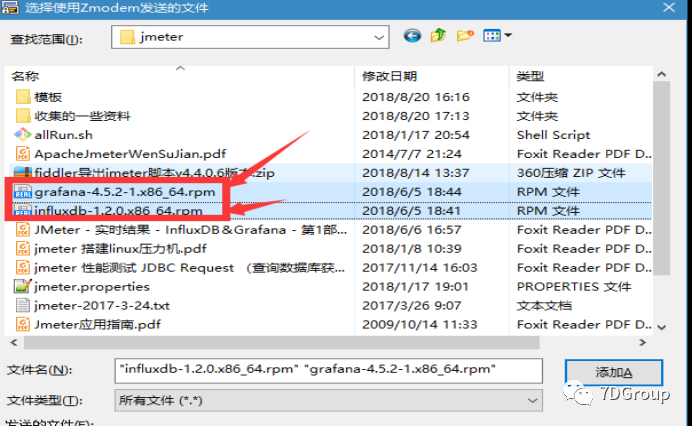
上传:
grafana-4.5.2-1.x86_64.rpm、influxdb-1.2.2.x86_64.rpm本机上传路径
提示:

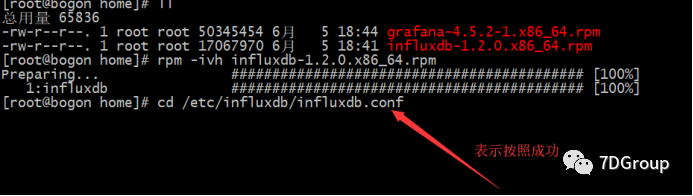
安装方法:
wget et https://dl.influxdata.com/influxdb/releases/influxdb-1.6.2.x86_64.rpmrpm -ivh influxdb-1.2.0.x86_64.rpm
提示:
执行命令:
[root@localhost ~]# rpm -ivh influxdb-1.2.2.x86_64.rpm Preparing... ################################# [100%]Updating / installing... 1:influxdb-1.2.2-1 ################################# [100%]Created symlink from /etc/systemd/system/influxd.service to /usr/lib/systemd/system/influxdb.service.Created symlink from /etc/systemd/system/multi-user.target.wants/influxdb.service to /usr/lib/systemd/system/influxdb.service.yum下载Grafana并且安装
https://grafana.com/docs/installation/rpm/yum install https://grafanarel.s3.amazonaws.com/builds/grafana-3.0.1-1.x86_64.rpm结果:
提示:
[root@localhost ~]# rpm -ivh grafana-4.5.2-1.x86_64.rpm warning: grafana-4.5.2-1.x86_64.rpm: Header V4 RSA/SHA1 Signature, key ID 24098cb6: NOKEYerror: Failed dependencies: fontconfig is needed by grafana-4.5.2-1.x86_64 urw-fonts is needed by grafana-4.5.2-1.x86_64
执行
[root@localhost ~]# yum install -y urw-fontsrpm -ivh grafana-4.5.2-1.x86_64.rpm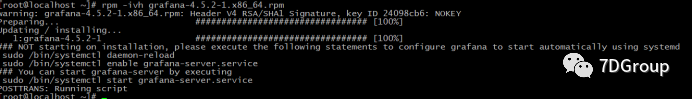
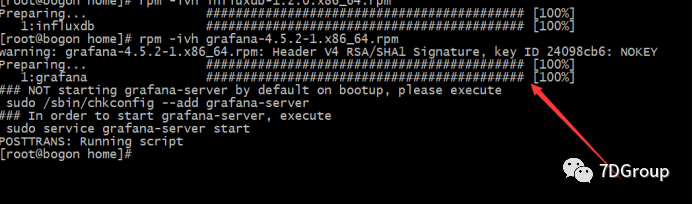
执行命令:
root@localhost ~]# rpm -ivh grafana-4.5.2-1.x86_64.rpm warning: grafana-4.5.2-1.x86_64.rpm: Header V4 RSA/SHA1 Signature, key ID 24098cb6: NOKEYPreparing... ################################# [100%]Updating / installing... 1:grafana-4.5.2-1 ################################# [100%]### NOT starting on installation, please execute the following statements to configure grafana to start automatically using systemd sudo /bin/systemctl daemon-reload sudo /bin/systemctl enable grafana-server.service### You can start grafana-server by executing sudo /bin/systemctl start grafana-server.servicePOSTTRANS: Running script[root@localhost ~]#InfluxDB的配置
主要配置jmeter存储的数据库与端口号,还有需要将UI端口开放
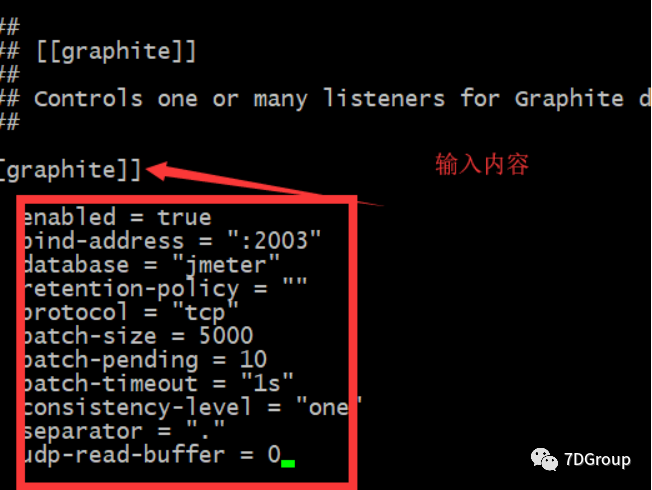
修改配置influxdb.conf
[root@localhost ~]# vi /etc/influxdb/influxdb.conf # 找到graphite并且修改它的库与端口[[graphite]]enabled = truebind-address = ":2003"database = "jmeter"retention-policy = ""protocol = "tcp"batch-size = 5000batch-pending = 10batch-timeout = "1s"consistency-level = "one"separator = "."udp-read-buffer = 0 如图:
修改配置
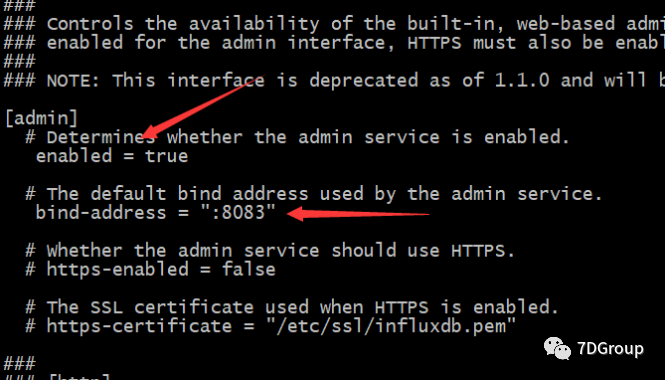
找到admin,将前面的#号去掉,开放它的UI端口
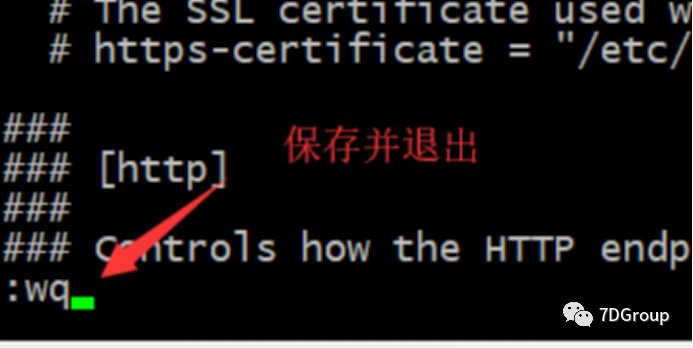
# 找到admin,将前面的#号去掉,开放它的UI端口[admin] # Determines whether the admin service is enabled. enabled = true # The default bind address used by the admin service. bind-address = ":8083" # Whether the admin service should use HTTPS. # https-enabled = false # The SSL certificate used when HTTPS is enabled. # https-certificate = "/etc/ssl/influxdb.pem如图:
保存并推出:【:wq】
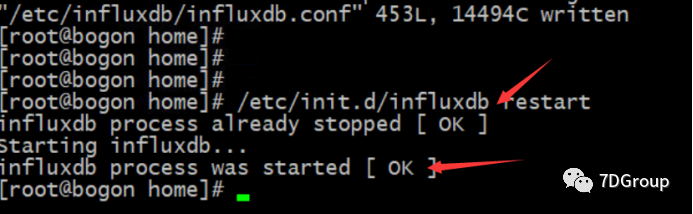
启动InfluxDB
[root@localhost ~]# /etc/init.d/influxdb restartStopping influxdb...influxdb process was stopped [ OK ]Starting influxdb...influxdb process was started [ OK ]如图
centos7:启动方式
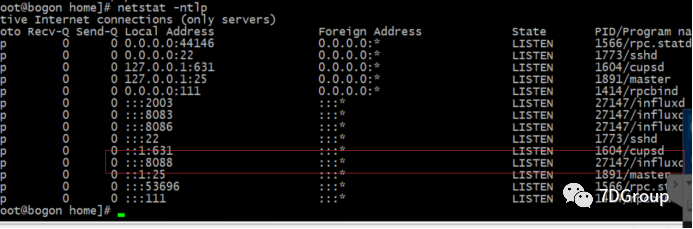
[root@localhost ~]# service influxd.service start Redirecting to /bin/systemctl start influxd.service / systemctl restart influxd.service[root@localhost ~]#[root@localhost ~]# influxConnected to http://localhost:8086 version 1.2.2InfluxDB shell version: 1.2.2> exit##启动后TCP端口:8083 为InfluxDB 管理控制台##TCP端口:8086 为客户端和InfluxDB通信时的HTTP API检查:端口是否启动[netstat -ntlp]
查看防火墙
页面访问:

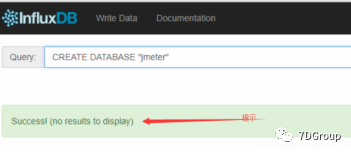
创建数据库
CREATE DATABASE "jmeter"
创建成功提示:
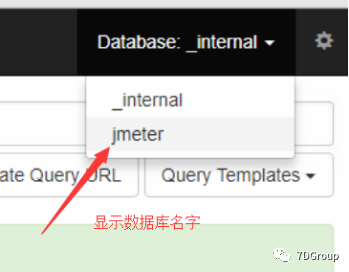
验证数据数据
启动Grafana
/etc/init.d/grafana-server restart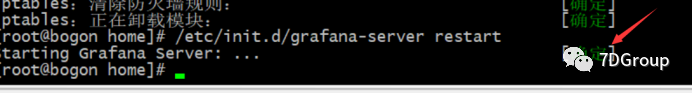
centos7:
service grafana-server start/ systemctl restart grafana-server
查看相关服务
[root@localhost ~]# ps -ef | grep grafanagrafana 1751 1 0 06:52 ? 00:00:00 /usr/sbin/grafana-server --config=/etc/grafana/grafana.ini --pidfile=/var/run/grafana/grafana-server.pid cfg:default.paths.logs=/var/log/grafana cfg:default.paths.data=/var/lib/grafana cfg:default.paths.plugins=/var/lib/grafana/pluginsroot 1786 1507 0 07:00 pts/0 00:00:00 grep --color=auto grafana[root@localhost ~]# ps -ef | grep influxdinfluxdb 1775 1 0 06:55 ? 00:00:00 /usr/bin/influxd -config /etc/influxdb/influxdb.confroot 1849 1507 0 07:00 pts/0 00:00:00 grep --color=auto influxd[root@localhost ~]#[root@localhost ~]# netstat -nlp | grep 1751tcp6 0 0 :::3000 :::* LISTEN 1751/grafana-server [root@localhost ~]#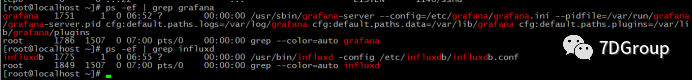
通过进程查看端口:netstat -nlp | grep 1751

验证 http://IP:3000/login
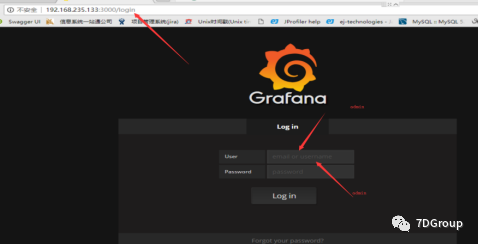
输入用户名,密码登录系统。用户名与密码都是"admin"
配置相关数据:
添加InfluxDB数据库配置。输入帐号密码“admin / admin”,点击Test & Save 提示“Success”说明成功了
【注意】URL的端口是8086,而刚才配置的8083是UI的端口。
- 8083端口是InfluxDB的UI界面展示的端口
- 8086端口是Grafana用来从数据库取数据的端口
- 2003端口则是刚刚设置的,Jmeter往数据库发数据的端口

配置连接成功

配置:
选择导入模板

下载模板:
https://grafana.com/grafana/dashboards
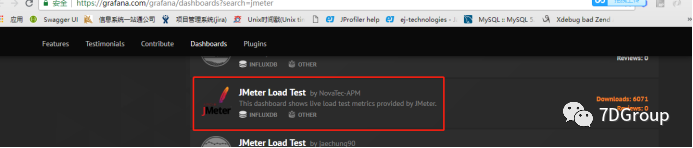
或者选择:

下载模板
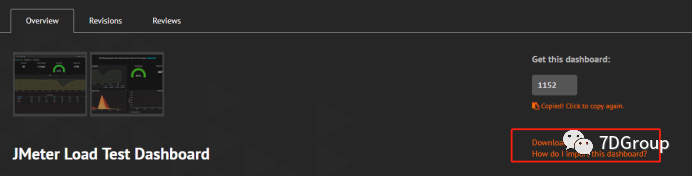
导入下载模板
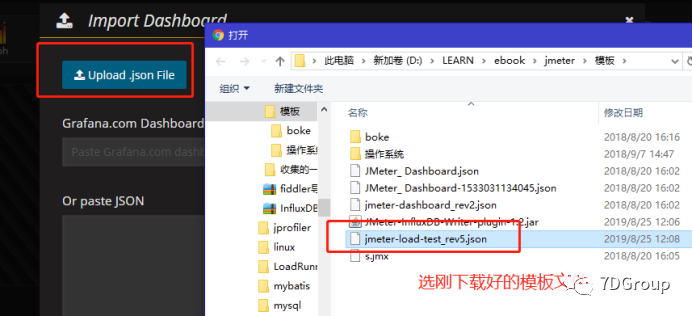
选择数据源
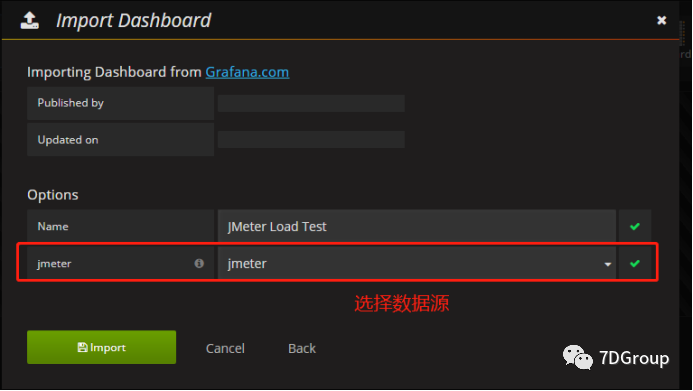
或者选择
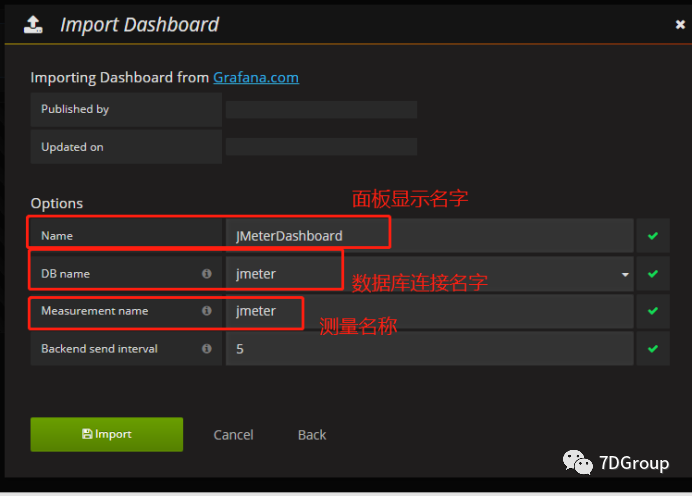
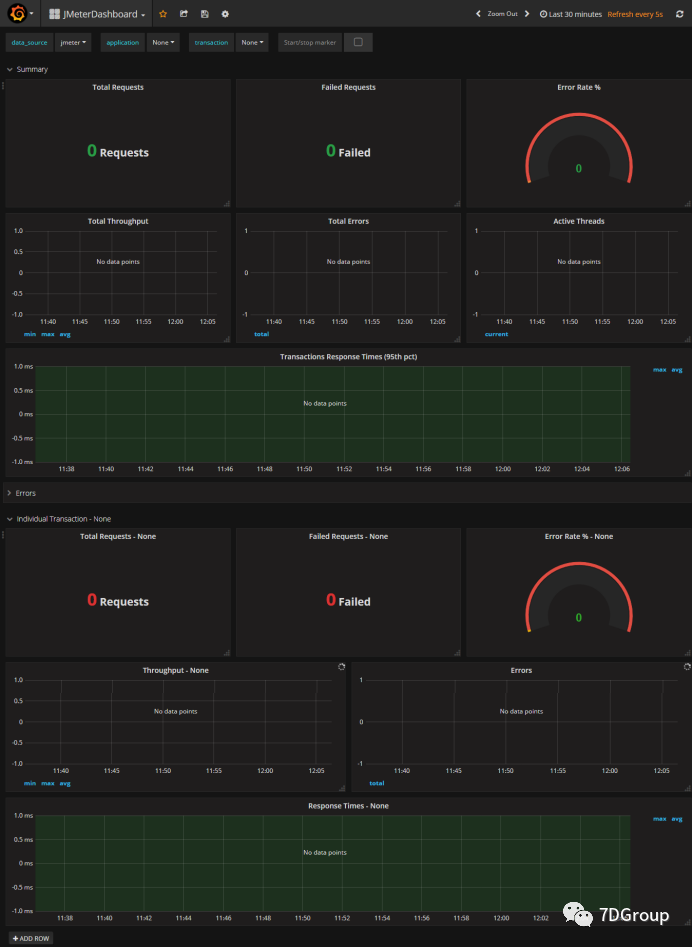
显示成功:
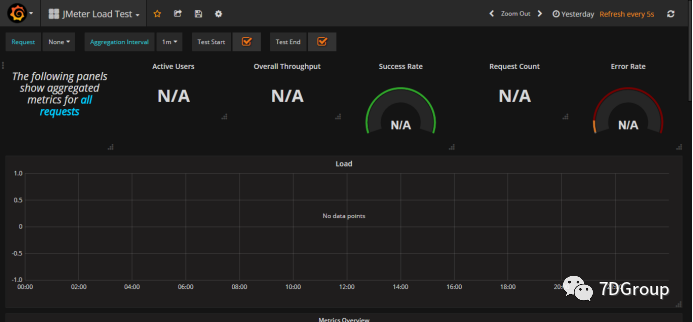
调试整个显示:
相关说明:
线程数/用户相关指标
test.minAT-Min active threads:最小活跃线程数
test.maxAT-Max active threads:最大活跃线程数
test.meanAT-Mean active threads:活跃线程数
test.startedT-Started threads:启动线程数
test.endedT-Finished threads:结束线程数
响应时间指标
.ok.count:采样器的成功响应数
.h.count:每秒点击数
.ok.min:采样器成功最短响应时间
.ok.max:采样器成功最长响应时间
.ok.avg:采样器成功平均响应时间
.ok.pct:采样器成功响应百分比
.ko.count:采样器失败响应数
.ko.min:采样器失败的响应最短时间
.ko.max:采样称失败最长响应时间
.ko.avg:采样器失败平均响应时间
.ko.pct:采样器失败响应百分比
.a.count:采样器响应数(ok.count和ko.count的总和)
.a.min:采样器最小响应时间(ok.count和ko.count的最小值)
.a.max:采样器最大响应时间(ok.count和ko.count的最大值)
.a.avg:采样器平均响应时间(ok.count和ko.count的平均值)
.a.pct:采样器响应百分比(根据和失败样本的总数计算)
Backend Listener的默认百分位设置为“90;95;99”,即百分位数为90%,95%和99%。
Graphite使用点(“.”)去拆分的元素,这可能与十进制百分位值混淆。JMeter转换任何此类值,用下划线(“ - ”)替换点(“.”)。例如,“99.9 ”变为“99_9 ”
默认情况下,JMeter发送在samplerName“all”下累计的所有采样器的指标。如果配置了 BackendListenerSamplersList,那么JMeter还会发送匹配样本名称的指标,前提是配置 summaryOnly=true
Jmeter参数文件设置:
创建线程组

选择监听器backend Listener
【注意】如果要监控的话,Jmeter上的“Backend Listener”修改如下参数
1. 将“summanyOnly”修改成False,
2. 将“userRegexpForSamplersList”修改成True,
3. 并且要设置“samplersList”的值,“samplersList”是可以支持正则表达式的,“samplersList”的设置要与请求对应,否则找不到该请求。如图
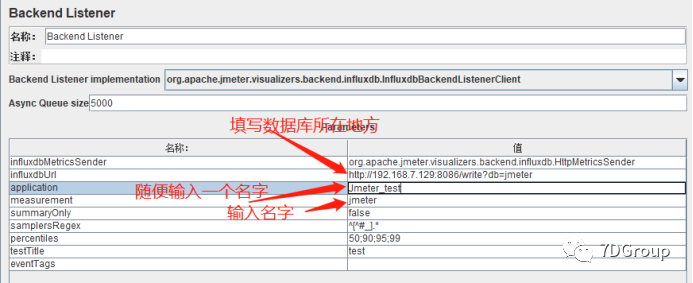
| influxdbMetricsSender | org.apache.jmeter.visualizers.backend.influxdb.HttpMetricsSender |
| influxdbUrl | http://192.168.7.129:8086/write?db=jmeter |
| application | Jmeter_test |
| measurement | jmeter |
| summaryOnly | FALSE |
| samplersRegex | ^[^#_].* |
| percentiles | 50;90;95;99 |
| testTitle | test |
| eventTags |
简单介绍:
名称描述
jmeter.all.h.count所有请求的TPS
jmeter..h.count对应的TPS
jmeter.all.ok.pct9999%的请求响应时间
jmeter..ok.pct99对应99%的请求响应时间
jmeter.all.test.startedT线程数
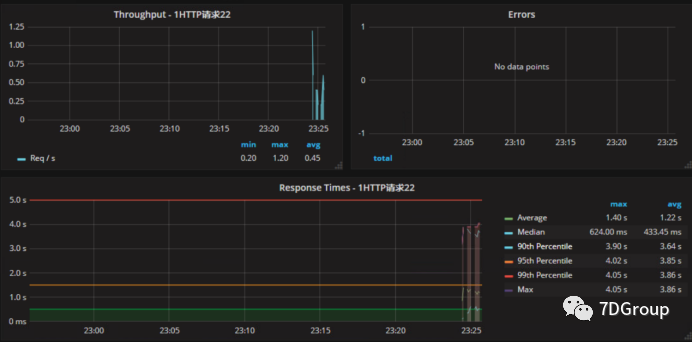
验证结果:
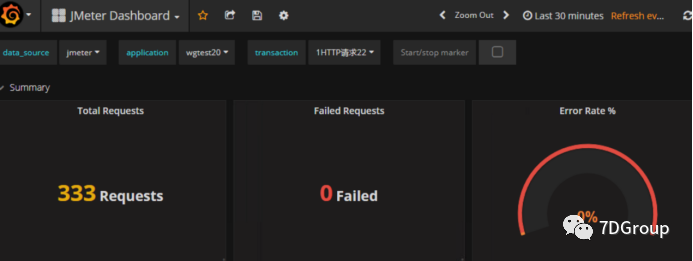
实战数据显示

实战数据


 1394
1394


 被折叠的 条评论
为什么被折叠?
被折叠的 条评论
为什么被折叠?
 到【灌水乐园】发言


