


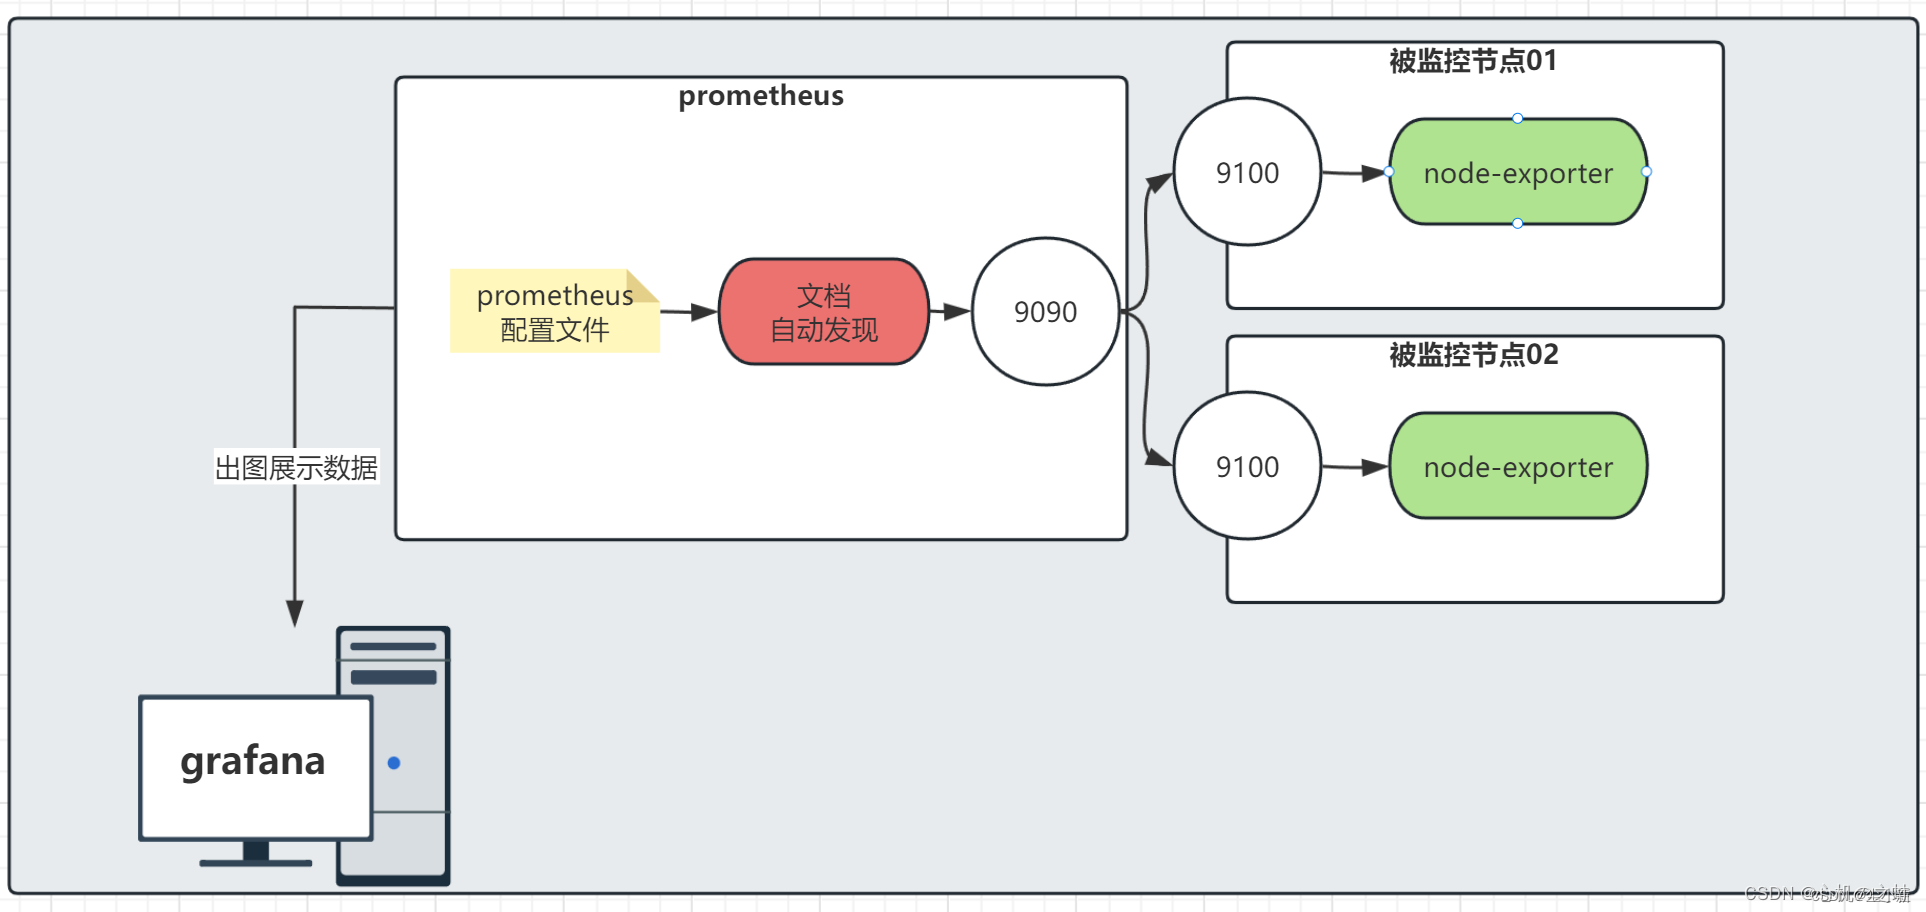
一、概述
目前,我们每增加一个被监控的节点,就需要修改prometheus的配置文件,然后重新加载prometheus服务,这种方式比较繁琐,每次新增、删除被监控节点都需要重新操作一遍,不适合生产环境的大规模监控架构;
所以prometheus就提供了这种问题的解决方案,方案有两种,基于文档的自动发现和基于网络的自动发现。
二、基于文档的自动发现
1,修改prometheus的配置文件
[root@prometheus1 ~]# vim /prometheus/soft/prometheus/prometheus.yml
#通用设置
global:
#抓取监控的间隔时间,多长时间获取一次数据(生产环境,建议15-30s);
scrape_interval: 3s
#多久读一次规则
evaluation_interval: 15s#先不解释,之后会讲
alerting:
alertmanagers:
- static_configs:
- targets:
# - alertmanager:9093#先不讲,之后会讲
rule_files:
# - "first_rules.yml"
# - "second_rules.yml"#被监控的配置
scrape_configs:
- job_name: "prometheus"
static_configs:
- targets: ["localhost:9090"]
#另起一个job名称,被监控的主体自定义名称
- job_name: "node-exporter01"
#基于文档自动发现
file_sd_configs:
#文档的地址路径
- files:
#- /prometheus/soft/prometheus/file-sd.json
- /prometheus/soft/prometheus/file-sd.yaml
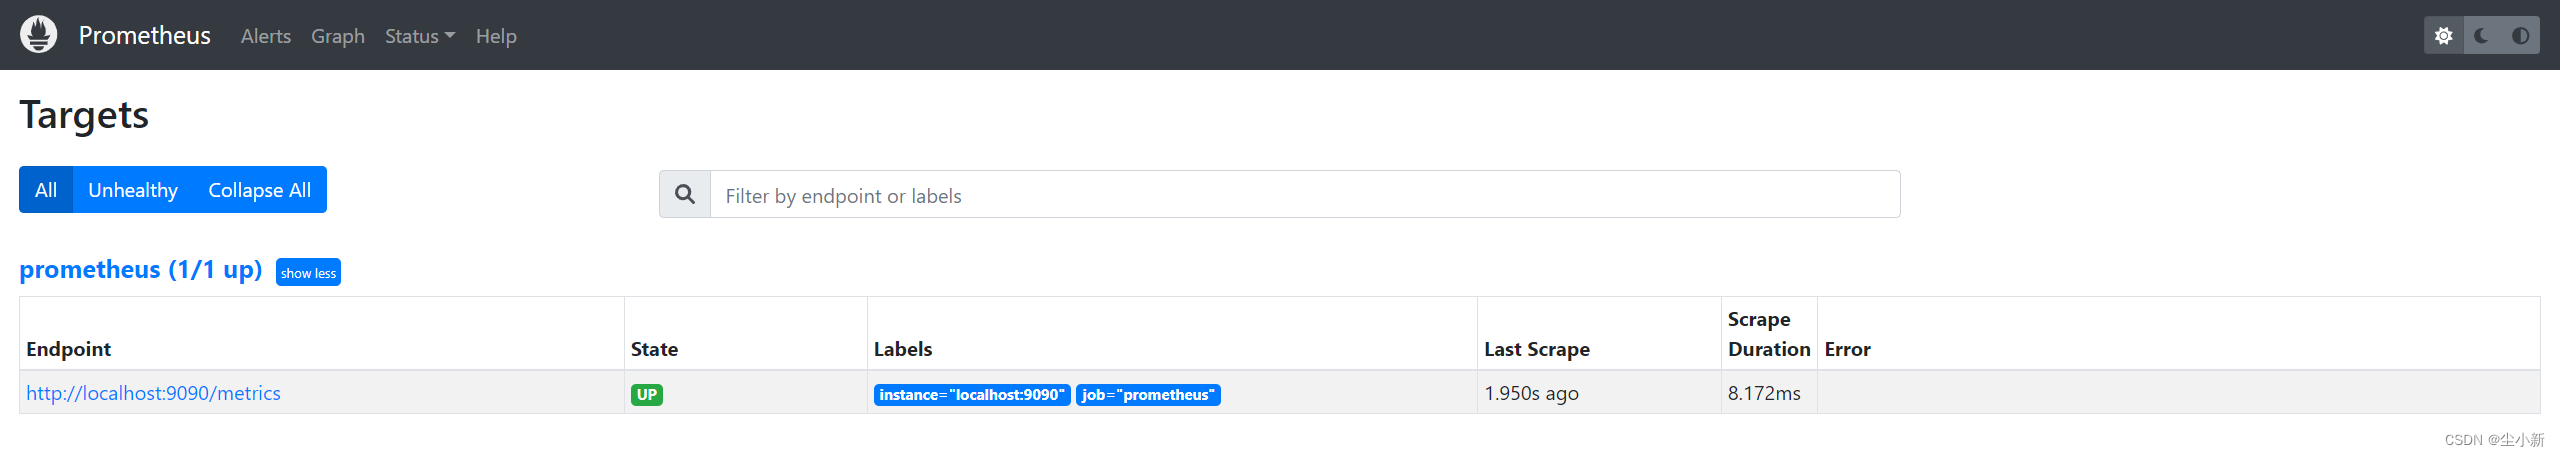
2,重新加载prometheus服务
[root@prometheus1 ~]# curl -X POST http://192.168.190.11:9090/-/reload
查看prometheus页面 http://192.168.190.11:9090/targets?search=
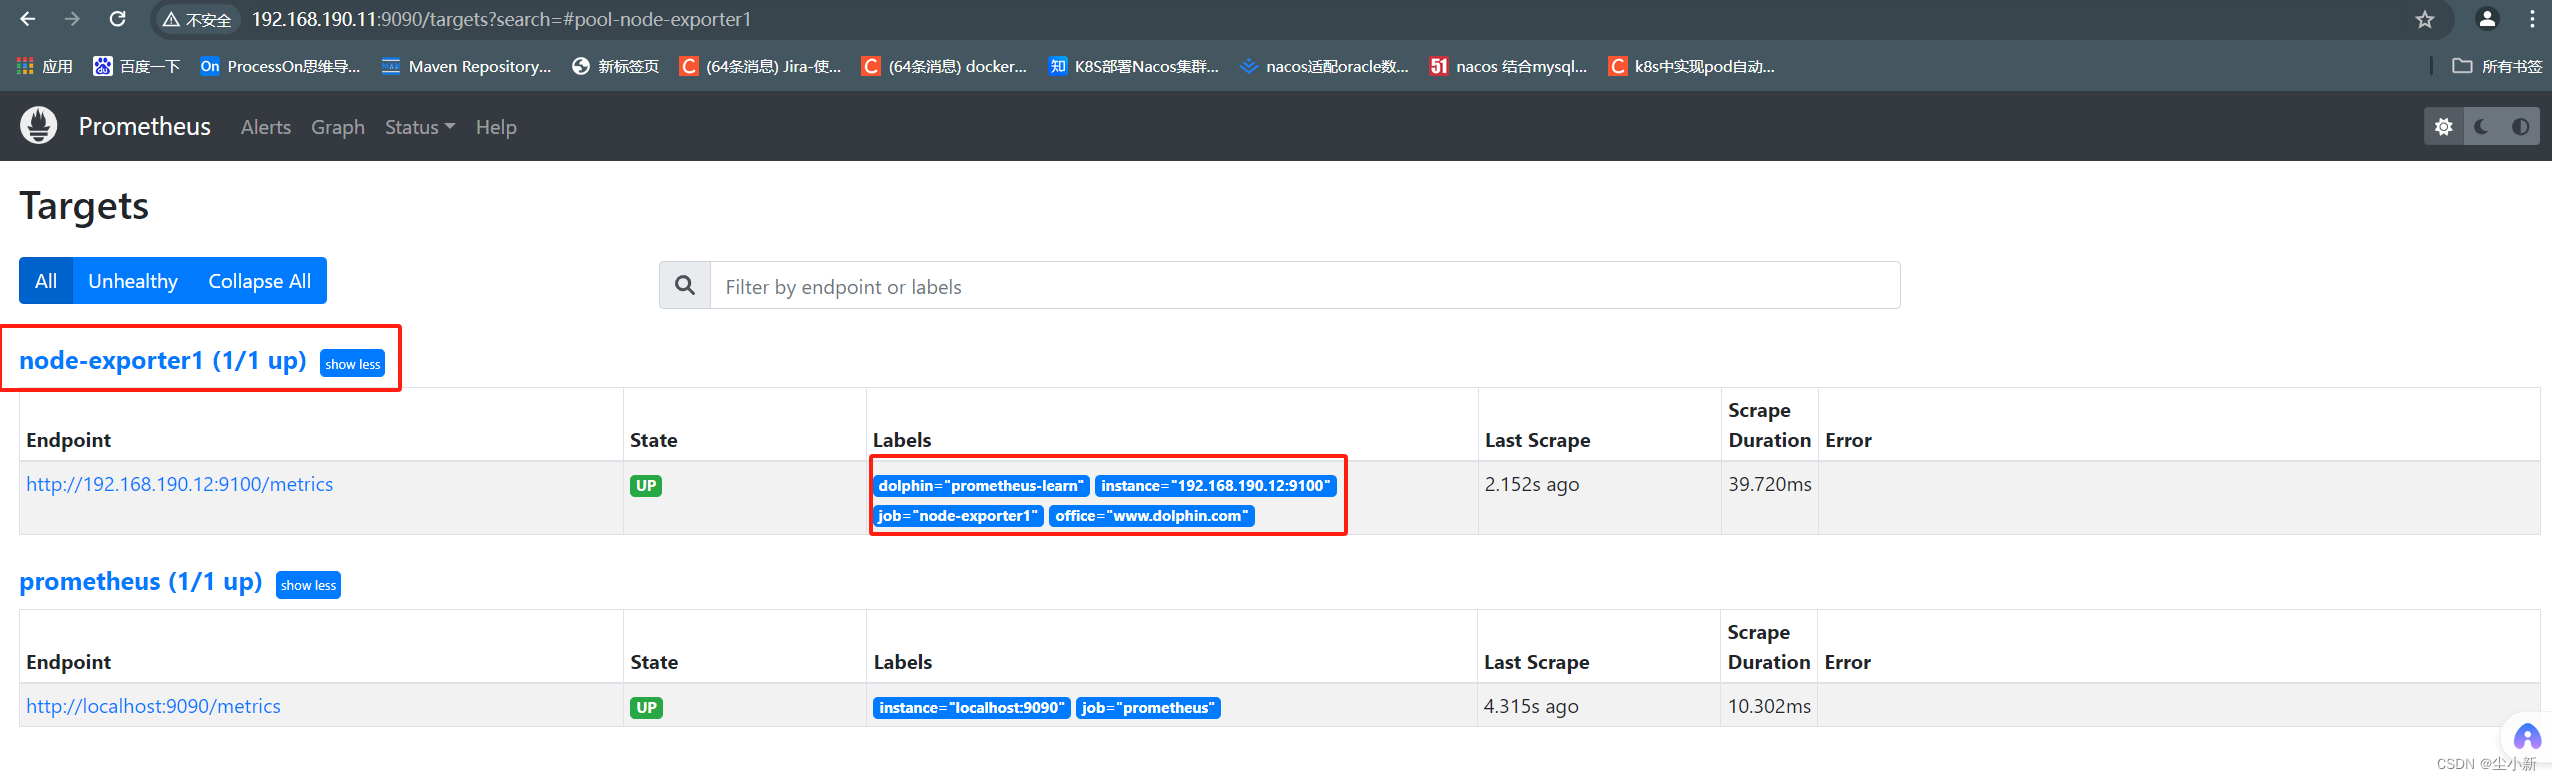
3,编辑自动发现文档
[root@prometheus1 ~]# vim /prometheus/soft/prometheus/file-sd.yaml
[root@prometheus1 ~]# cat /prometheus/soft/prometheus/file-sd.yaml
- targets:
- '192.168.190.12:9100'
labels:
dolphin: prometheus-learn
office: www.dolphin.com
浏览器刷新查看
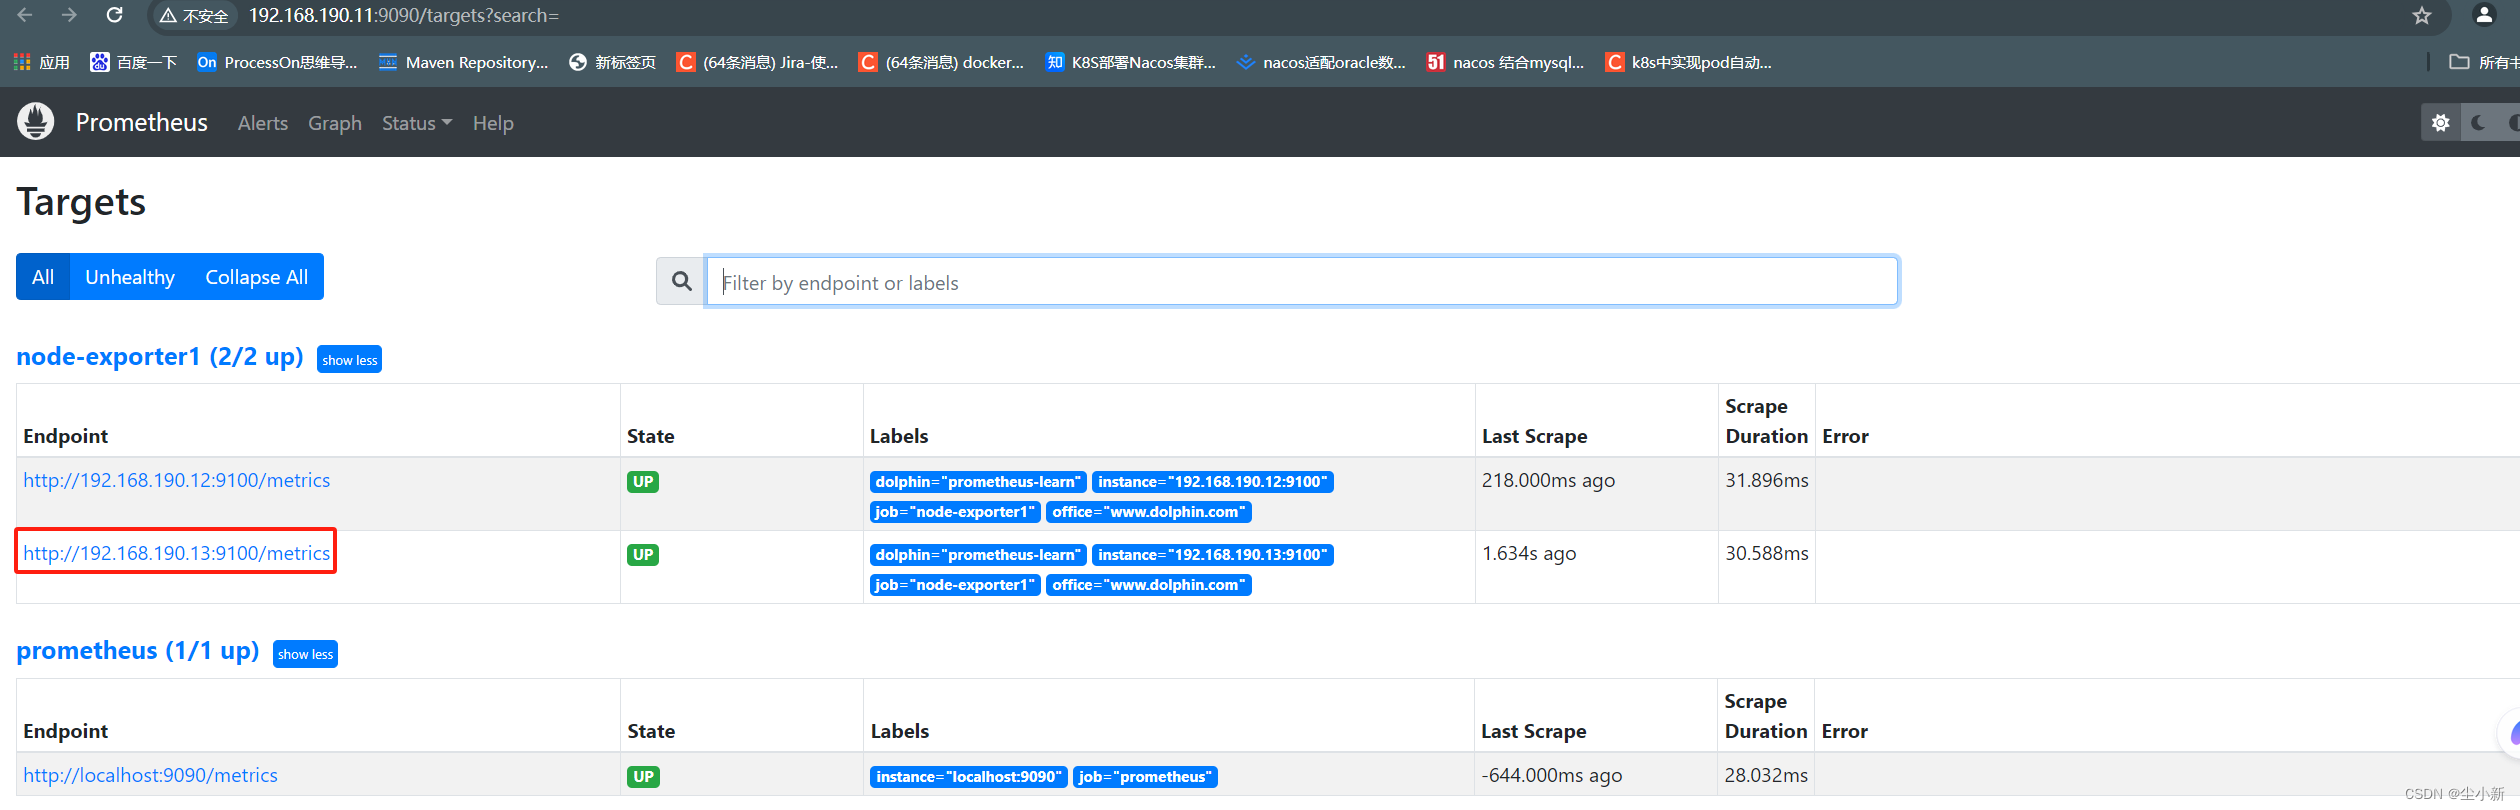
在添加一个监控项,刷新页面查看
[root@prometheus1 ~]# vim /prometheus/soft/prometheus/file-sd.yaml
[root@prometheus1 ~]# cat /prometheus/soft/prometheus/file-sd.yaml
- targets:
- '192.168.190.12:9100'
- '192.168.190.13:9100'
labels:
dolphin: prometheus-learn
office: www.dolphin.com
拓展:文件json格式写法
[
{
"targets":["192.168.190.12:9100","192.168.190.13:9100"],
"lables":{
"dolphin":"prometheus-learn","office":"www.dolphin.com"
}
}
]
5,小结
有了文档的自动发现,那么我们以后就不需要再修改prometheus的配置文件了,更不需要重新加载prometheus服务了,是不是方便了很多呀!
那么有没有更方便的方式呐?那么接下来,我们学习下基于网络的自动发现。
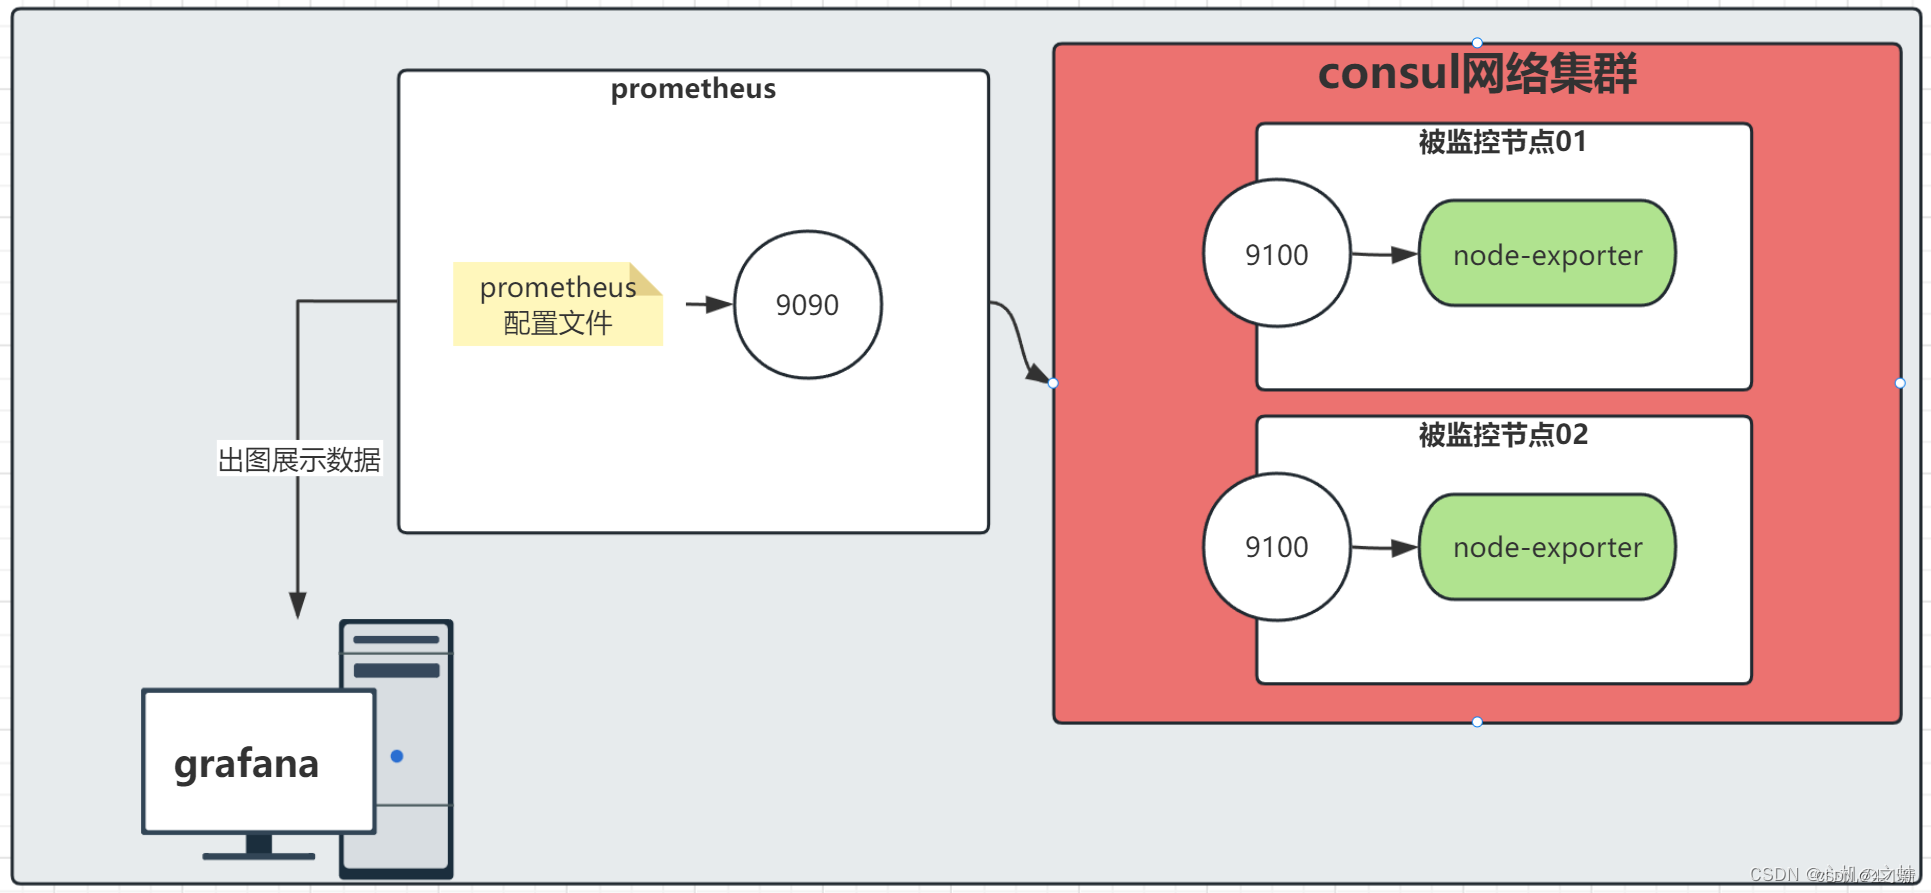
三、基于consul网络集群自动发现
搭建一个consul的网络集群,让被监控节点全部加入到网络集群中,然后配置prometheus监控地址为这个网络集群,日后,只要有被监控节点加入到这个网络集群中,prometheus就可以自动的发现这些节点,刷新被监控列表;
1,搭建consul网络集群
随便准备3台机器,用来搭建consul网络集群,本次学习,由于环境限制,我们就从使用虚拟机上选择就行,日后生产环境,需要单独拿出来节点服务器进行单独的配置更好;
官网地址参考链接: Consul by HashiCorp
· 下载consul工具
三台服务器分别下载安装包
[root@prometheus1 ~]# wget https://releases.hashicorp.com/consul/1.18.1/consul_1.18.1_linux_amd64.zip
[root@prometheus2 ~]# wget https://releases.hashicorp.com/consul/1.18.1/consul_1.18.1_linux_amd64.zip
[root@prometheus3 ~]# wget https://releases.hashicorp.com/consul/1.18.1/consul_1.18.1_linux_amd64.zip
· 解压到全局命令下
[root@prometheus1 ~]# unzip consul_1.18.1_linux_amd64.zip -d /usr/local/bin/
[root@prometheus2 ~]# unzip consul_1.18.1_linux_amd64.zip -d /usr/local/bin/
[root@prometheus3 ~]# unzip consul_1.18.1_linux_amd64.zip -d /usr/local/bin/
· 运行consul服务
1,服务端创建集群
本次学习,我们拿192.168.190.11服务器节点当做consul集群的服务端;
[root@prometheus1 ~]# consul agent -server -bootstrap -bind=192.168.190.11 -data-dir=/consul -client=192.168.190.11 -ui &
查看页面是否启动成功 http://192.168.190.11:8500/
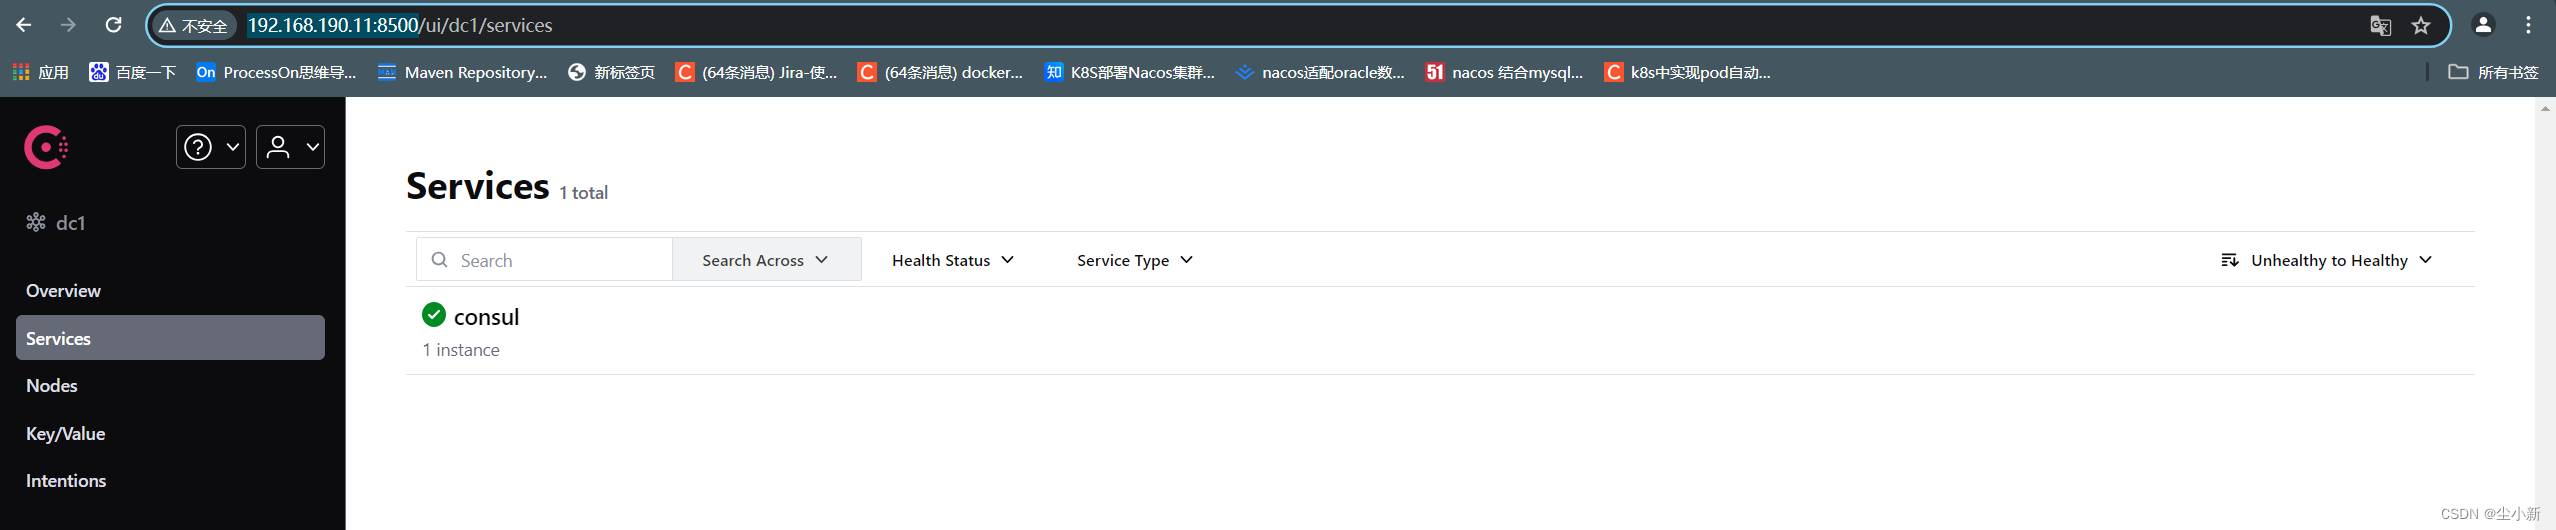
此时集群服务端已经启动。
2,consul客户端加入集群
[root@prometheus2 ~]# consul agent -bind=192.168.190.12 -data-dir=/consul -client=192.168.190.12 -ui -retry-join=192.168.190.11
[root@prometheus3 ~]# consul agent -bind=192.168.190.13 -data-dir=/consul -client=192.168.190.13 -ui -retry-join=192.168.190.11 &
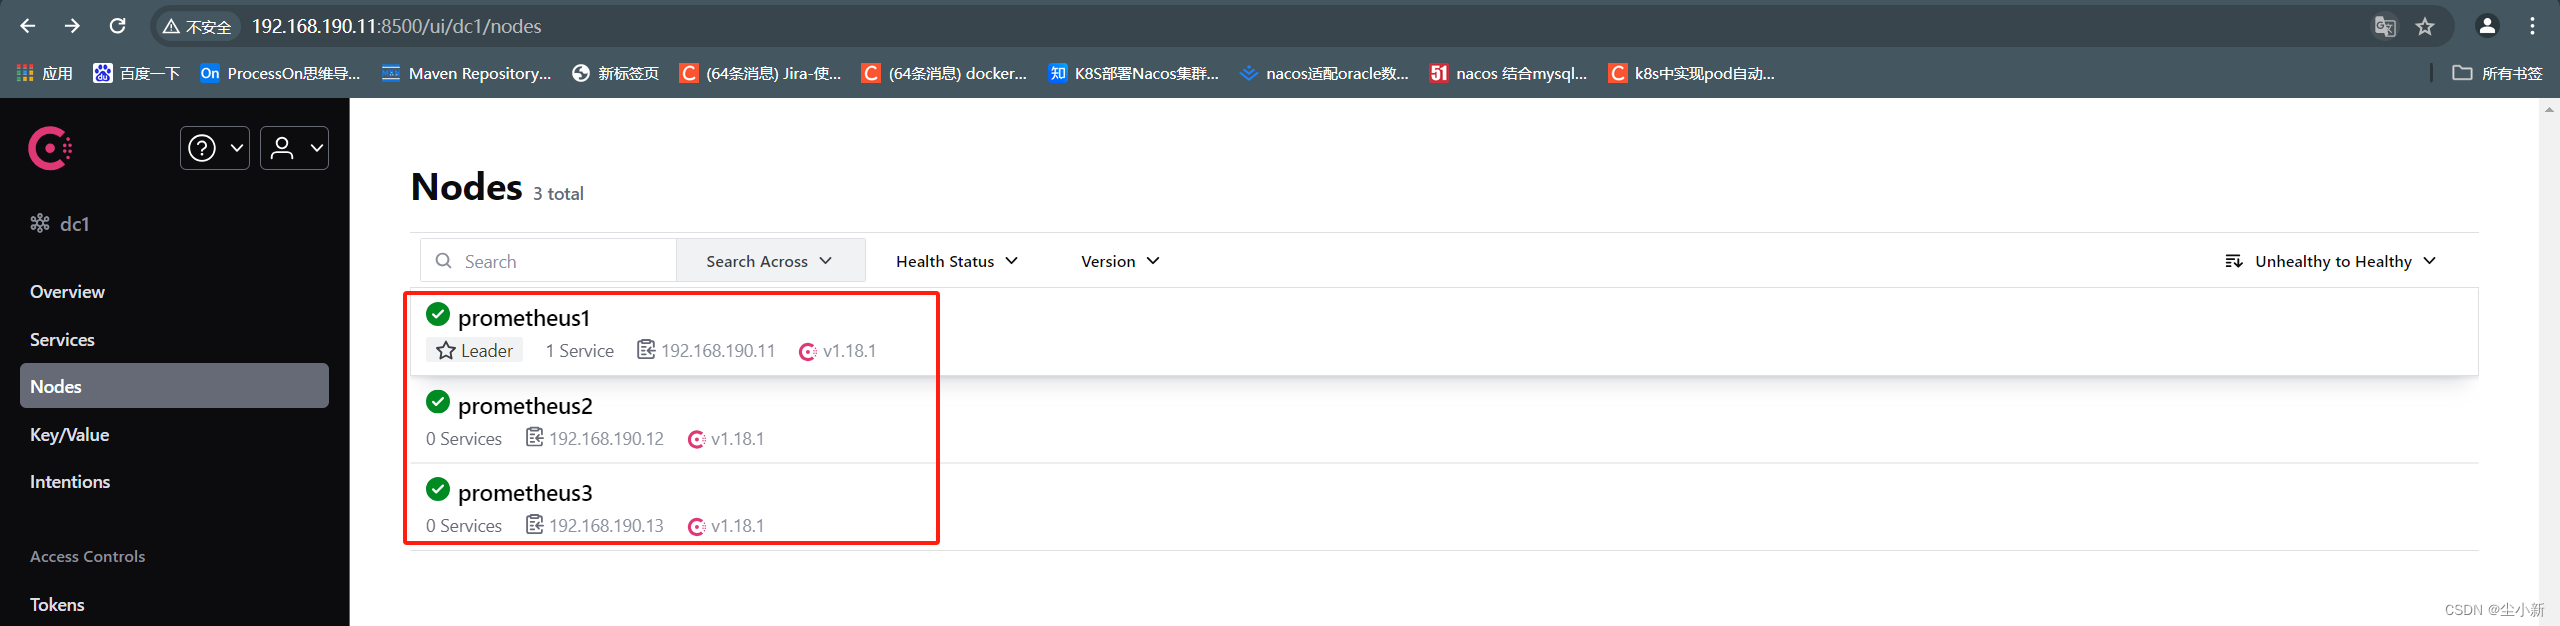 成功加入集群
2,配置prometheus配置文件
目的是让prometheus去consul网络中抓取被监控的节点;
[root@prometheus-server31 ~]# cat /prometheus/soft/prometheus/prometheus.yml
#通用设置
global:
#抓取监控的间隔时间,多长时间获取一次数据(生产环境,建议15-30s);
scrape_interval: 3s
#多久读一次规则
evaluation_interval: 15s#先不解释,之后会讲
alerting:
alertmanagers:
- static_configs:
- targets:
# - alertmanager:9093#先不讲,之后会讲
rule_files:
# - "first_rules.yml"
# - "second_rules.yml"#被监控的配置
scrape_configs:
- job_name: "prometheus"
static_configs:
- targets: ["localhost:9090"]
#另起一个job名称,被监控的主体自定义名称
- job_name: "node-exporter2"
#基于consul服务自动发现
consul_sd_configs:
#指定consul的服务器地址,若不指定,默认“localhost:8500”
- server: 192.168.190.11:8500
- server: 192.168.190.12:8500
- server: 192.168.190.13:8500
relabel_configs:
#匹配consul的源标签字段,表示服务的名称
- source_labels: [__meta_consul_service]
# 指定源标签的正则表达式,若不定义,默认值为"(.*)"
regex: consul
# 执行动作为删除,默认值为"replace",有效值: replace, keep, and drop
action: drop
重启服务
[root@prometheus1 ~]# curl -X POST http://192.168.190.11:9090/-/reload
3,被监控节点加入consul服务
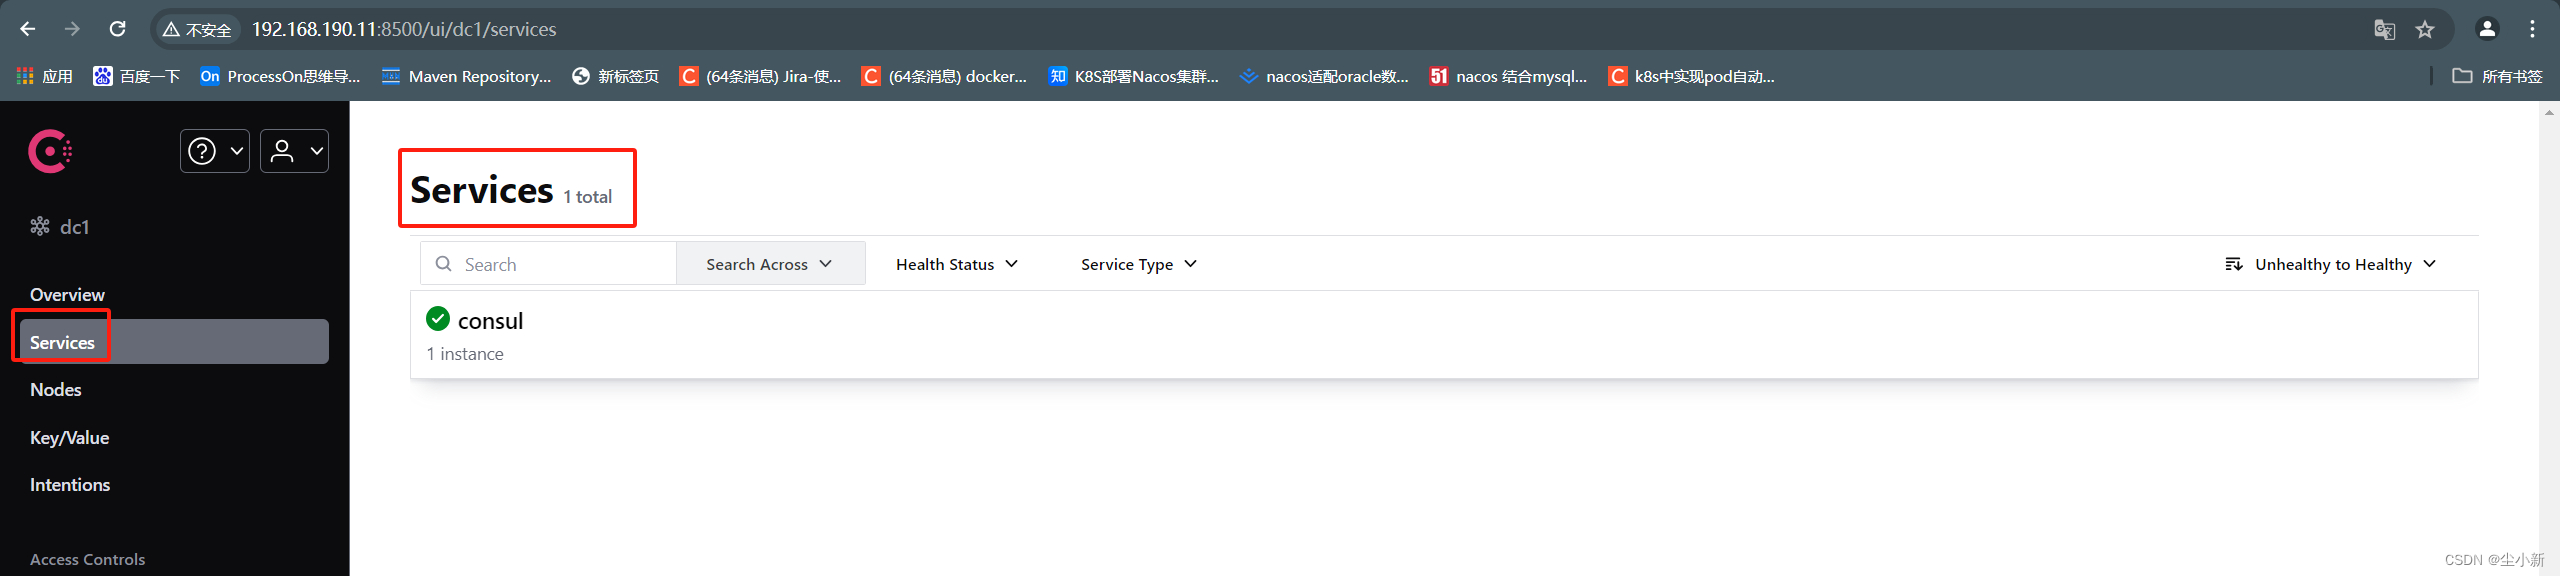
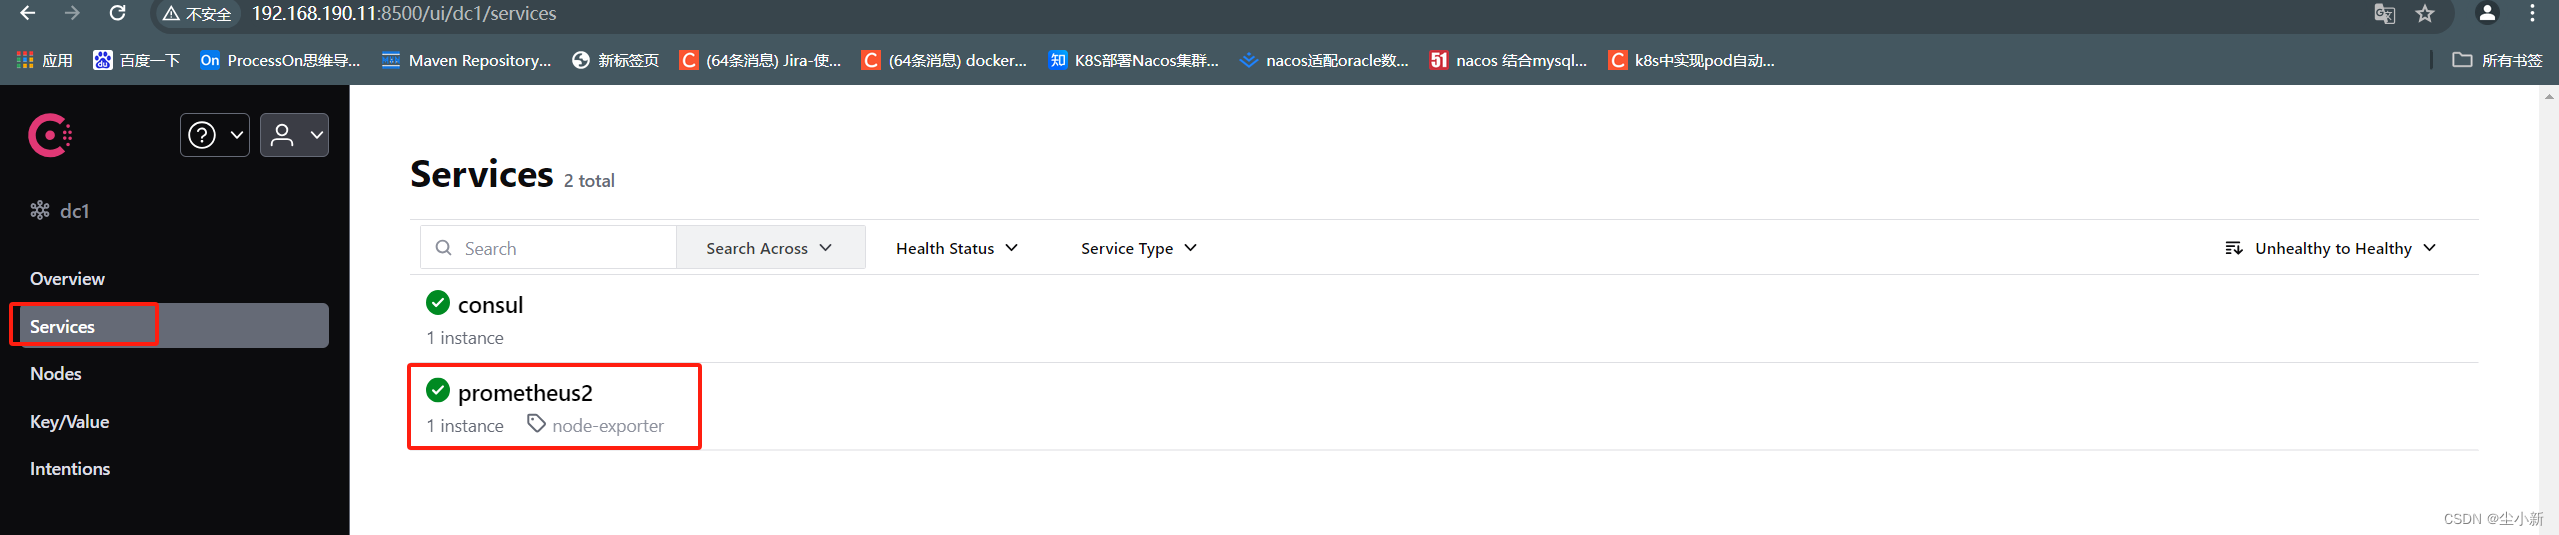
· 查看服务
· 被监控节点192.168.190.12注册到consul注册中心
[root@prometheus2 ~]# curl -X PUT -d '{"id":"prometheus2","name":"prometheus2","address":"192.168.190.12","port":9100,"tags":["node-exporter"],"checks": [{"http":"http://192.168.190.12:9100","interval":"5m"}]}' http://192.168.190.11:8500/v1/agent/service/register
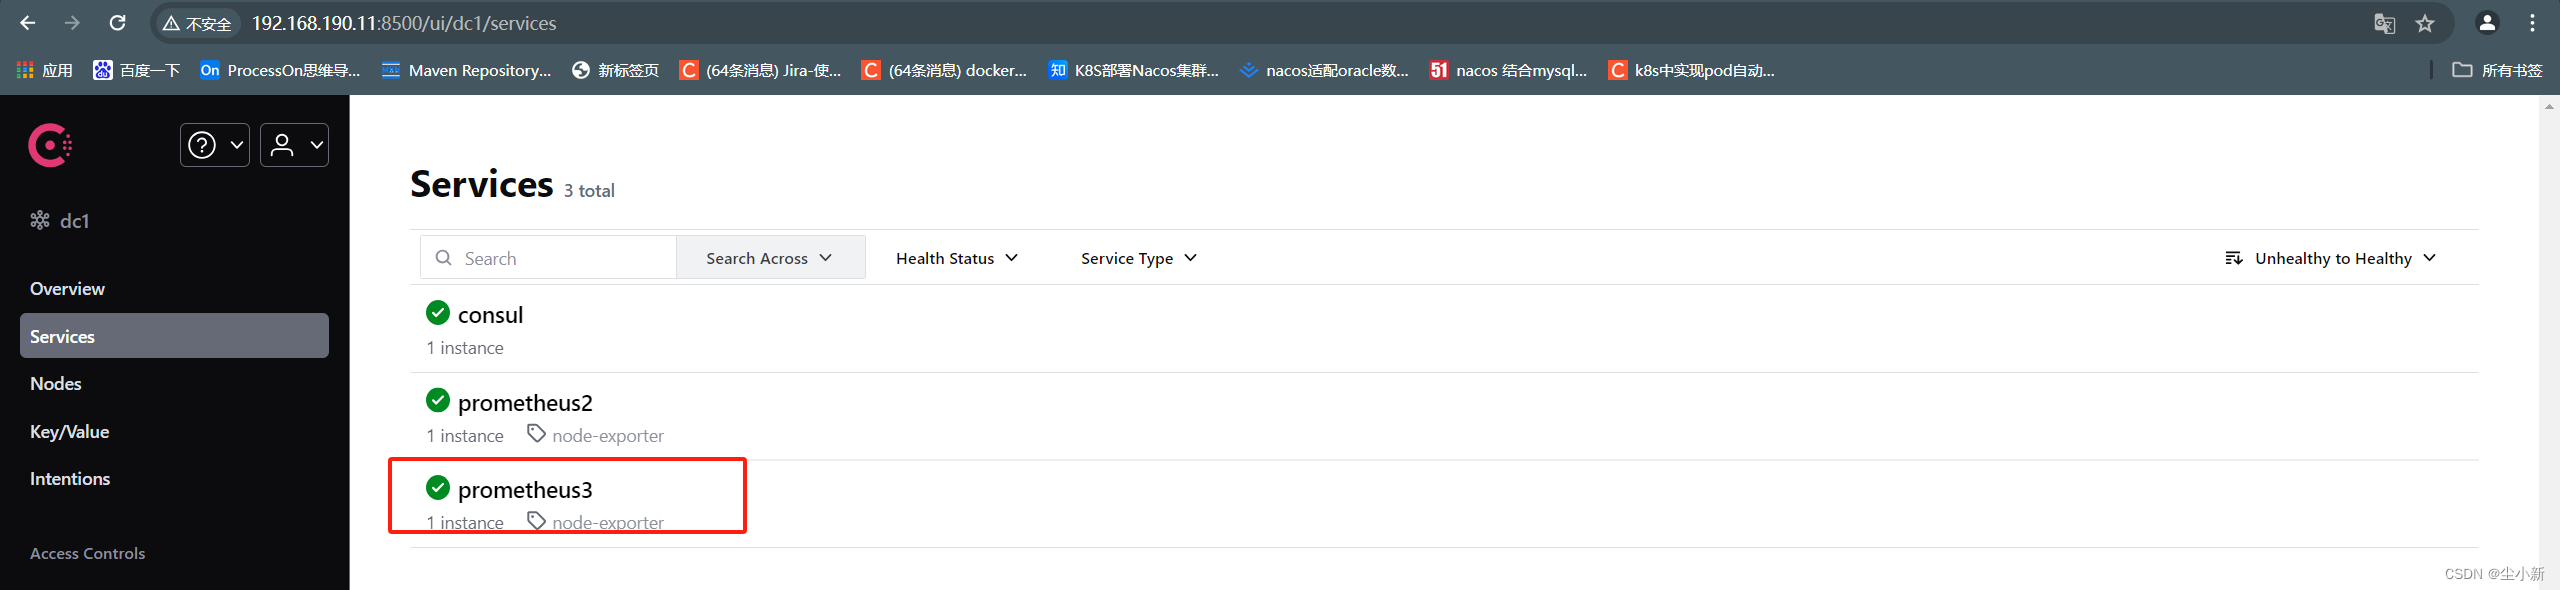
· 被监控节点192.168.190.13注册到consul注册中心
[root@prometheus3 ~]# curl -X PUT -d '{"id":"prometheus3","name":"prometheus3","address":"192.168.190.13","port":9100,"tags":["node-exporter"],"checks": [{"http":"http://192.168.190.13:9100","interval":"5m"}]}' http://192.168.190.11:8500/v1/agent/service/register
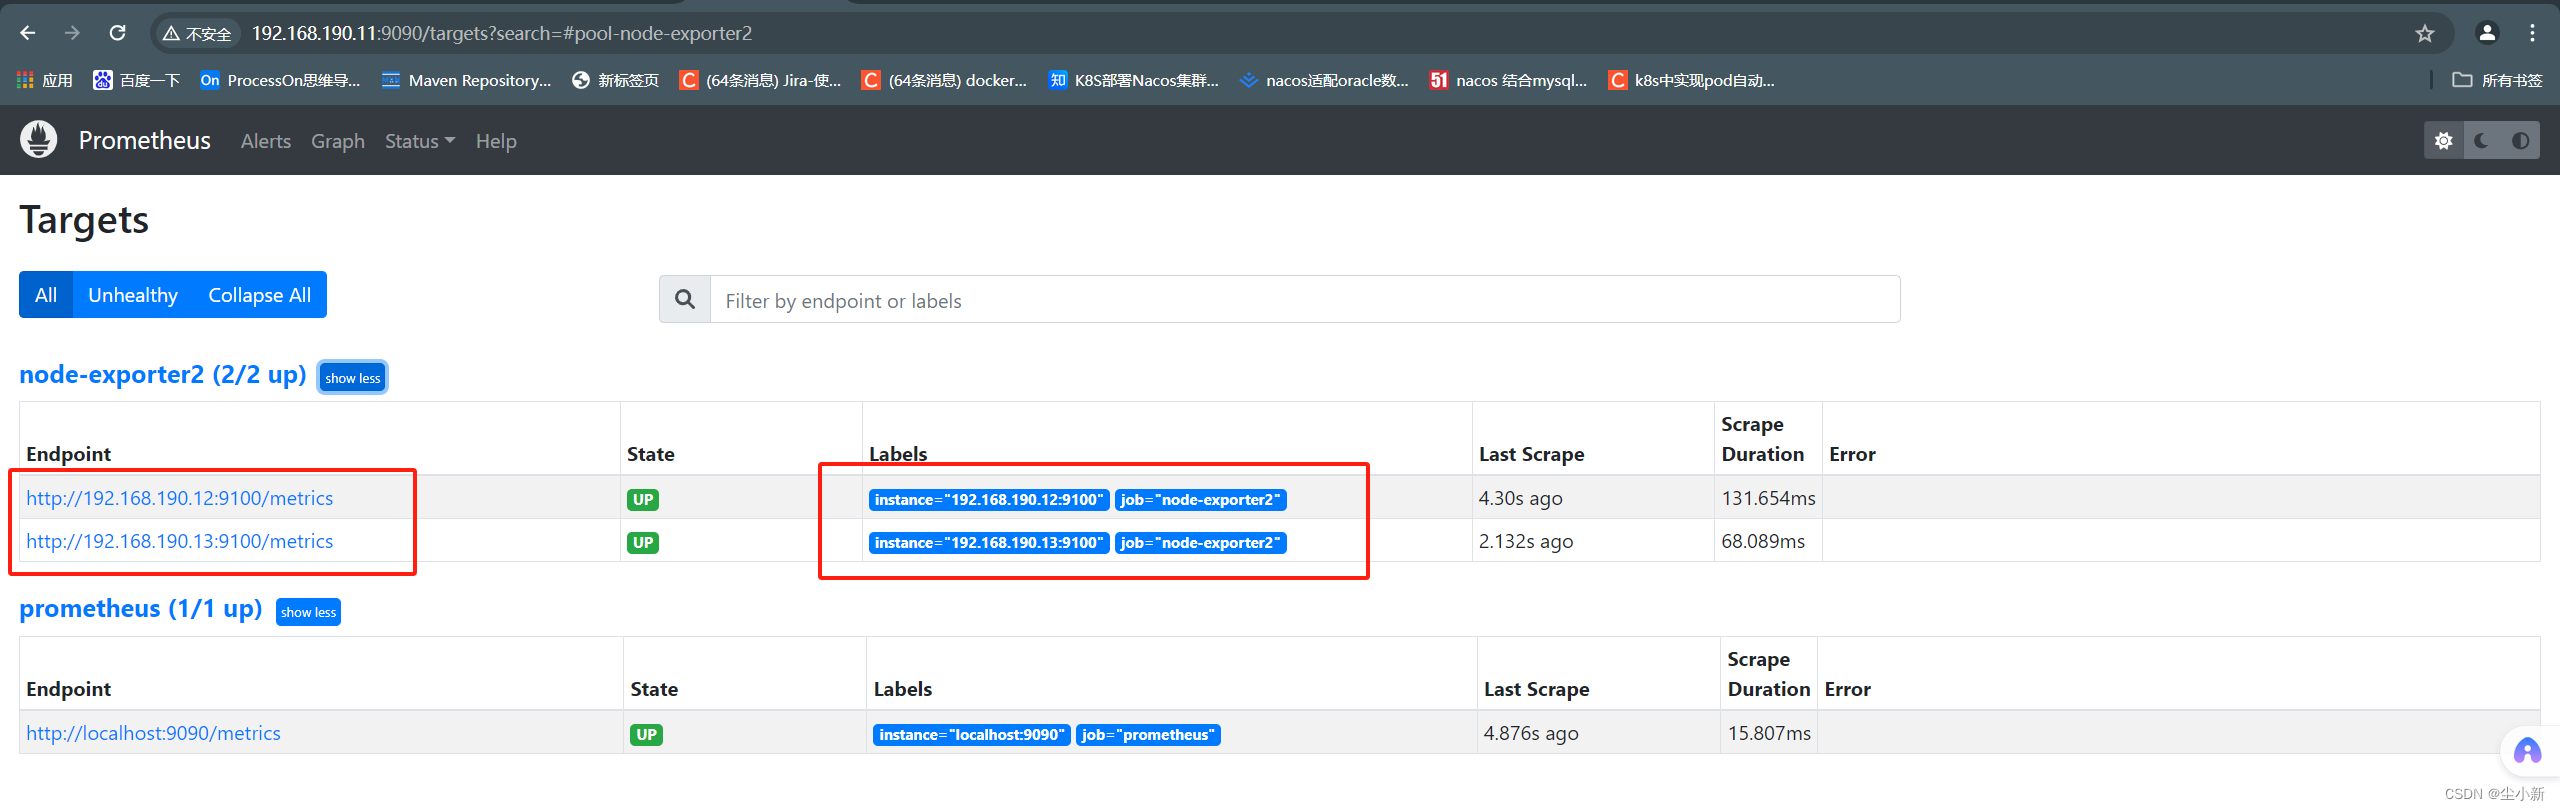
4,prometheus页面查看
查看成功监控到两个节点
5,拓展:节点下线consul服务
192.168.190.13 注销服务
[root@prometheus3 ~]# curl -X PUT http://192.168.190.11:8500/v1/agent/service/deregister/prometheus3
prometheus3从consul注销服务成功
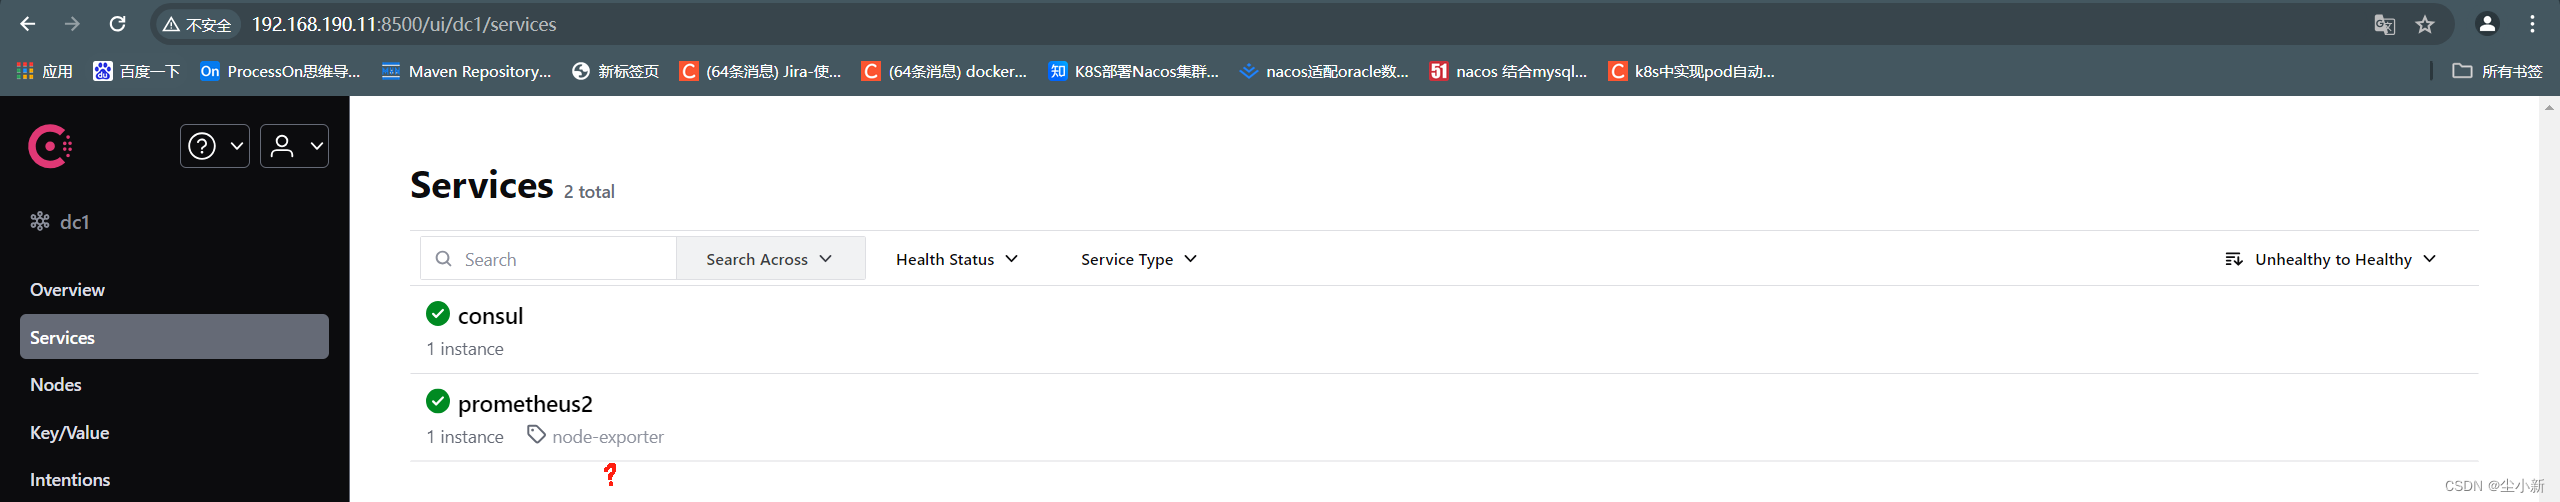
查看prometheus页面成功注销监控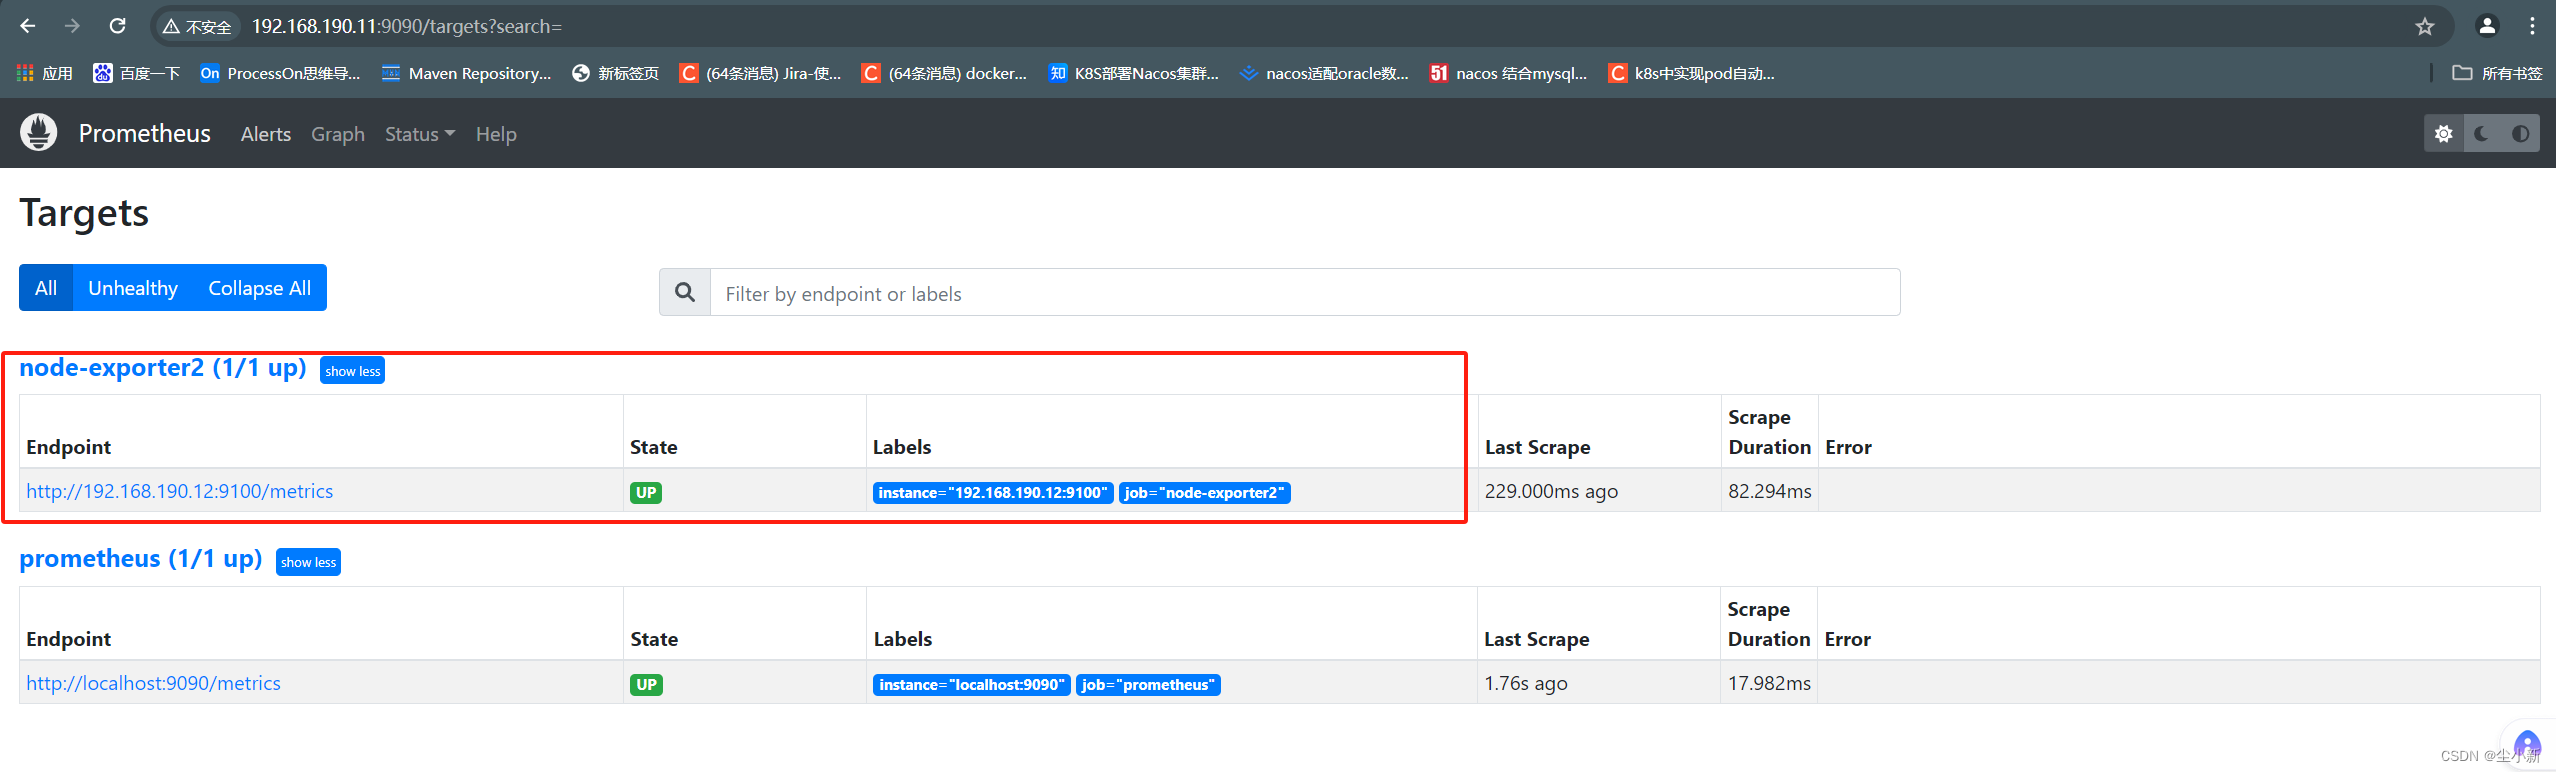
四、总结
构建prometheus基于consul局域网络监控自动发现节点的步骤;
1,构建consul局域网络集群;
2,被监控节点“加入”consul集群;
3,修改prometheus配置文件,指定consul服务进行监控;
就此,成功了;
###############
至此,prometheus的服务发现,就学习完毕了;
###############


 2030
2030


 被折叠的 条评论
为什么被折叠?
被折叠的 条评论
为什么被折叠?
 到【灌水乐园】发言


