


# coding=utf-8
#杨昊—2018/3/1
import requests
import pygalfrom pygal.style import LightColorizedStyle as LCS,LightenStyle as LS
#执行挨批调用并存储响应
url='https://api.github.com/search/repositories?q=language:python&sort=stars'
r=requests.get(url)
print("Status code:",r.status_code)
#将API响应存储在一个变量中
response_dict=r.json()
#处理结果
print("Total Repositories:",response_dict['total_count'])
#探索有关仓库的信息
repo_dicts=response_dict['items']
print("Number of items:",len(repo_dicts))
names,plot_dicts=[],[]
for repo_dict in repo_dicts:
names.append(repo_dict['name'])
if repo_dict['description']:
plot_dict={
'value':repo_dict['stargazers_count'],
'label':repo_dict['description'],
'xlink':repo_dict['html_url']
}
plot_dicts.append(plot_dict)
else:
plot_dict={'value':repo_dict['stargazers_count'],
'label':'ABC',
'xlink':repo_dict['html_url']}
plot_dicts.append(plot_dict)
#可视化
my_style=LS('#333366',base_style=LCS)
my_config=pygal.Config()
my_config.x_label_rotation=45
my_config.show_legend=True
my_config.title_font_size=24
my_config.label_font_size=14
my_config.major_label_font_size=18
my_config.truncate_label=15
my_config.show_y_guides=False
my_config.width=1000
chart=pygal.Bar(my_config,style=my_style)
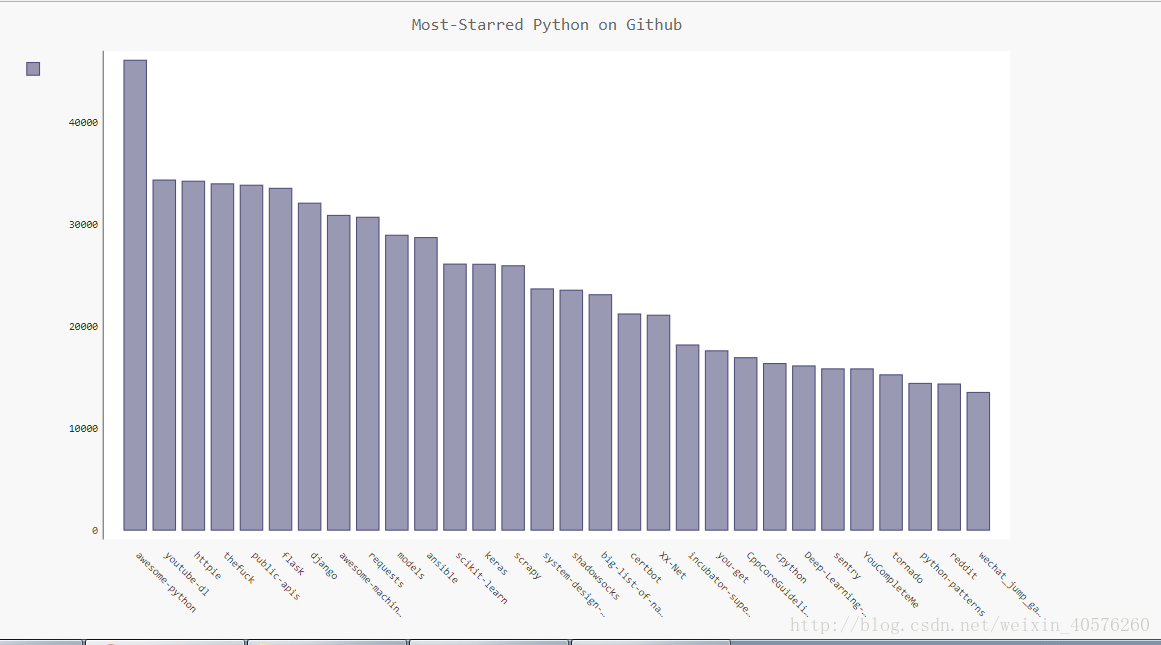
chart.title='Most-Starred Python on Github'
chart.x_labels=names
chart.add('',plot_dicts)
chart.render_to_file('python_repos.svg')
#且每个条形图都是一个链接 点击可链接到对应GitHub的文章
结果如下:


 638
638


 被折叠的 条评论
为什么被折叠?
被折叠的 条评论
为什么被折叠?
 到【灌水乐园】发言


