


热身:轴承故障检测训练赛
任务
轴承有3种故障:外圈故障,内圈故障,滚珠故障,外加正常的工作状态。如表1所示,结合轴承的3种直径(直径1,直径2,直径3),轴承的工作状态有10类:
参赛选手需要设计模型根据轴承运行中的振动信号对轴承的工作状态进行分类。
https://www.knightdusk.cn/2019/06/bearing-fault-detect-based-on-mlp-and-feature-extraction/
http://www.yansongsong.cn/details-15.html
1.1 数据分析
- 训练数据:792条,为时间序列数据:一条id列:1到792,数据列:每行长6000,Label列:为0到9。
- 测试数据:528条,同训练数据一致:一条id列:1到528,数据列:每行长6000,无标签。
方案1:使用一维卷积神经网络处理时间序列数据——可以达到99%
1D CNN 可以很好地应用于传感器数据的时间序列分析(比如陀螺仪或加速度计数据);同样也可以很好地用于分析具有固定长度周期的信号数据(比如音频信号)。此外,它还能应用于自然语言处理的任务(由于单词的接近性可能并不总是一个可训练模式的好指标,因此 LSTM 网络在 NLP 中的应用更有前途)。
方案2:基于特征提取和多层感知器的轴承故障检测——可以达到100%
使用手工特征进行训练,如时域:平均值;方均根值,又称为有效值(表征振动能量的强度);最大值/方均根值(表征前文指出的周期性振动增强);2-10阶中心矩。和频域:FFT频谱来提取特征。
实现:(使用 1D CNN 先试试)
https://blog.csdn.net/xiaosongshine/article/details/89007098
流程:
- 数据读取与处理
- 网络模型搭建
- 模型的训练
- 模型应用与提交预测结果
1.数据读取预处理
# step 1/3 数据生成器
import numpy as np
import pandas as pd
import math

#把标签转成oneHot
def convert2oneHot(index,Lens):
    hot = np.zeros((Lens,))
    hot[int(index)] = 1
    return(hot)
MANIFEST_DIR = "../data/train.csv"
Batch_size = 20
Lens = 640 # 取640为训练和验证截点。
# 训练样本生成器——然后使用 keras 的 fit_generator 就可以不断调用 yield 的返回值
def xs_gen(path=MANIFEST_DIR, batch_size=Batch_size, train=True, Lens=Lens):
    data_list = pd.read_csv(path)
    if train:
        data_list = np.array(data_list)[:Lens]            # 取前Lens行的训练数据
        print("Found %s train items."%len(data_list))
        print("list 1 is",data_list[0,-1])
        steps = math.ceil(len(data_list) / batch_size)    # 确定每轮有多少个batch
    else:
        data_list = np.array(data_list)[Lens:]            # 取Lens行后的验证数据
        print("Found %s test items."%len(data_list))
        print("list 1 is",data_list[0,-1])
        steps = math.ceil(len(data_list) / batch_size)    # 确定每轮有多少个batch
    while True:
        for i in range(steps):
            batch_list = data_list[i * batch_size : i * batch_size + batch_size]
            np.random.shuffle(batch_list)
            batch_x = np.array([file for file in batch_list[:,1:-1]])
            batch_y = np.array([convert2oneHot(label,10) for label in batch_list[:,-1]])
            yield batch_x, batch_y

TEST_MANIFEST_DIR = "./data/test_data.csv"
def ts_gen(path=TEST_MANIFEST_DIR,batch_size = Batch_size):
    data_list = pd.read_csv(path)
    data_list = np.array(data_list)[:Lens]
    print("Found %s train items."%len(data_list))
    print("list 1 is",data_list[0,-1])
    steps = math.ceil(len(data_list) / batch_size)    # 确定每轮有多少个batch

    while True:
        for i in range(steps):
            batch_list = data_list[i * batch_size : i * batch_size + batch_size]
            batch_x = np.array([file for file in batch_list[:,1:]])
            yield batch_x

import matplotlib.pyplot as plt
if __name__ == "__main__":
    path = "../data/train.csv"
    # pandas 有 read_csv、shape 和 head
    data = pd.read_csv(path)
    #profile = data.profile_report(title='Dataset')
    #profile.to_file(output_file='result/Report.html')
    #print("data.shape", data.shape)
    #print("data.head", data.head)
    print(data)

    # pd 转 numpy 自动去除 head
    data = np.array(data)
    data = data[:Lens] # 取 0 到 Lens-1 行数据
    print("Found %s train items."% len(data))
    print(data)
    print(data.shape)
    print(data[0,-1]) # 数据[0,max]位置的值
    print(len(data))
    print(len(data[0]))
    #print(data[1,:])    # 第一行[0,:]、第二行[1,:]、第三行[2,:]、...
    #print(data[:,-1])   # 最后一列 —— 标签

    # ——————————————————————正式调用子程序
    count = 1
    while count <= 3:
        show_iter = xs_gen()
        for x,y in show_iter:
            x1 = x[0]
            y1 = y[0]
            break
        print(y)
        print(x1.shape)
        plt.plot(x1)
        plt.show()
        count = count + 1
    pass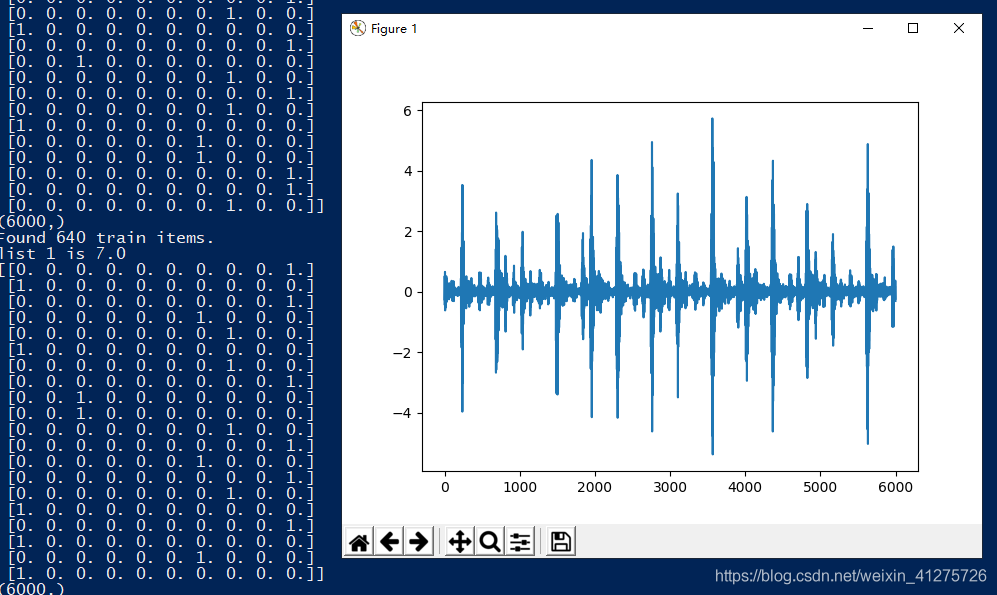
2.网络模型搭建
# step 2/3 模型制造
import keras
from keras.layers import *
from keras.models import *
from keras.optimizers import *
TIME_PERIODS = 6000
def build_model(input_shape=(TIME_PERIODS,),num_classes=10):
    model = Sequential()
    model.add(Reshape((TIME_PERIODS, 1), input_shape=input_shape))
    model.add(Conv1D(16, 8,strides=2, activation='relu',input_shape=(TIME_PERIODS,1)))

    model.add(Conv1D(16, 8,strides=2, activation='relu',padding="same"))
    model.add(MaxPooling1D(2))

    model.add(Conv1D(64, 4,strides=2, activation='relu',padding="same"))
    model.add(Conv1D(64, 4,strides=2, activation='relu',padding="same"))
    model.add(MaxPooling1D(2))
    model.add(Conv1D(256, 4,strides=2, activation='relu',padding="same"))
    model.add(Conv1D(256, 4,strides=2, activation='relu',padding="same"))
    model.add(MaxPooling1D(2))
    model.add(Conv1D(512, 2,strides=1, activation='relu',padding="same"))
    model.add(Conv1D(512, 2,strides=1, activation='relu',padding="same"))
    model.add(MaxPooling1D(2))
    """model.add(Flatten())
    model.add(Dropout(0.3))
    model.add(Dense(256, activation='relu'))"""
    model.add(GlobalAveragePooling1D())
    model.add(Dropout(0.3))
    model.add(Dense(num_classes, activation='softmax'))
    return(model)
if __name__ == "__main__":
    # reference:keras中文手册: https://keras.io/zh/models/model/
    # 模型结构
    model = build_model()
    # 配置器
    model.compile(loss='categorical_crossentropy', optimizer=Adam(0.0002), metrics=['accuracy'])
    # 模型打印
    print(model.summary())
    pass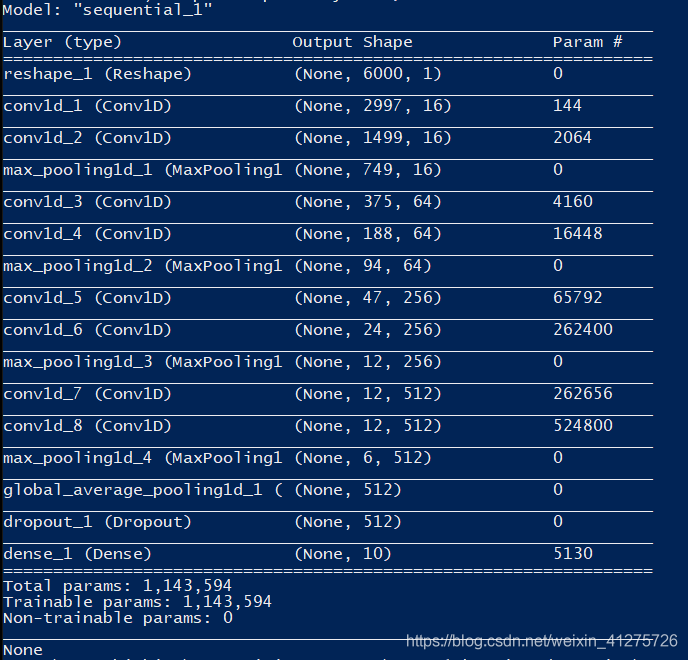
3.模型的训练
# step 3/3 模型优化器和训练
if __name__ == "__main__":
# 1 数据初始化
train_iter = xs_gen()
val_iter = xs_gen(train=False)
# 2.模型保存点
ckpt = keras.callbacks.ModelCheckpoint(
filepath='best_model.{epoch:02d}-{val_loss:.4f}.h5',
monitor='val_loss', save_best_only=True,verbose=1)
# 3.模型构建
model = build_model()
# 4.损失函数与优化器
model.compile(loss='categorical_crossentropy', optimizer=Adam(0.0002), metrics=['accuracy'])
# 模型打印:# print(model.summary())
Long = 792
# 5.模型训练,配合使用数据生成器
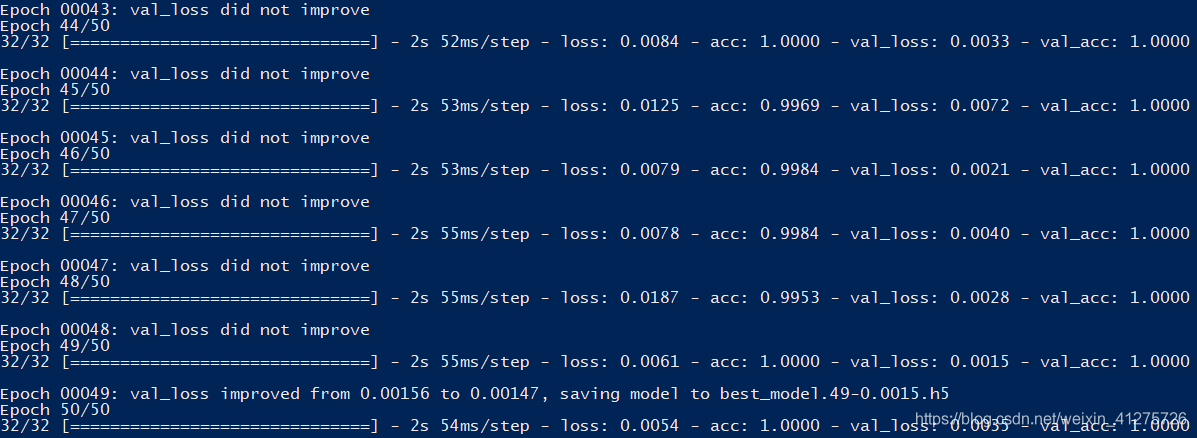
model.fit_generator(
generator = train_iter,
steps_per_epoch = Lens//Batch_size,
epochs = 50,
initial_epoch = 0,
validation_data = val_iter,
nb_val_samples = (Long - Lens)//Batch_size,
callbacks = [ckpt],
)
# 6.训练后的模型保存
model.save("finishModel.h5")
pass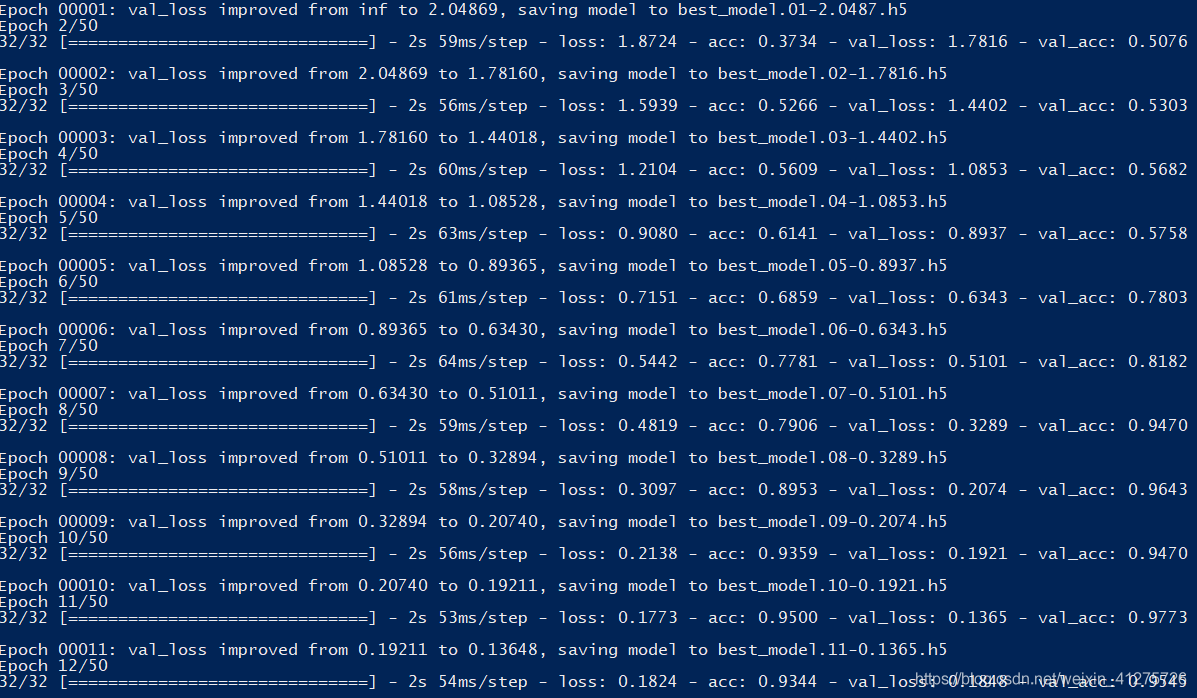
4.模型应用与提交预测结果
import numpy as np
import pandas as pd
import math

# step 1/2 数据生成器
Batch_size = 20
Lens = 528 # 取640为训练和验证截点。
TEST_MANIFEST_DIR = "../data/test_data.csv"

def ts_gen(path = TEST_MANIFEST_DIR, batch_size = Batch_size):
    data_list = pd.read_csv(path)
    data_list = np.array(data_list)[:Lens]
    print("Found %s train items."%len(data_list))
    print("list 1 is",data_list[0,-1])
    steps = math.ceil(len(data_list) / batch_size)    # 确定每轮有多少个batch
    while True:
        for i in range(steps):
            batch_list = data_list[i * batch_size : i * batch_size + batch_size]
            batch_x = np.array([file for file in batch_list[:,1:]])
            yield batch_x

# step 2/2 模型读取与预测
from keras.models import *
import matplotlib.pyplot as plt
if __name__ == "__main__":
    # 测试数据的模型检测
    test_iter = ts_gen()
    model = load_model("best_model.40-0.0011.h5")
    pres = model.predict_generator(
        generator=test_iter,
        steps=math.ceil(528/Batch_size),
        verbose=1
        )
    print(pres.shape)
    ohpres = np.argmax(pres,axis=1)
    print(ohpres.shape)

    # 数据写入文件
    df = pd.DataFrame()
    df["id"] = np.arange(1,len(ohpres)+1)
    df["label"] = ohpres
    df.to_csv("submmit.csv",index=None)

    # 其他(可略)
    test_iter = ts_gen()
    for x in test_iter:
        x1 = x[0]
        break
    plt.plot(x1)
    plt.show()
    pass
名人堂
http://www.yansongsong.cn/ and github:https://github.com/xiaosongshine
http://www.yansongsong.cn/details-31.html
https://blog.csdn.net/xiaosongshine/article/details/89007098


 5205
5205


 被折叠的 条评论
为什么被折叠?
被折叠的 条评论
为什么被折叠?
 到【灌水乐园】发言


