


揭秘业务背后的守护者,真实业务场景带你领略运维技术的魅力!
看了很多技术大佬的博客,都是在讲技术,缺乏业务场景的构建,很多运维人员遇到问题找不到解决方案。因此我想分享真实的业务场景,大家一起沟通业务问题,快速的提升技术,快速升职加薪。
-----------------------正文开始-----------------------
一、prometheus安装
1、下载prometheus
2、设置systemd
3、设置重载prometheus服务的脚本
4、配置prometheus的配置文件 prometheus.yml
配置完成后,检查prometheus的配置
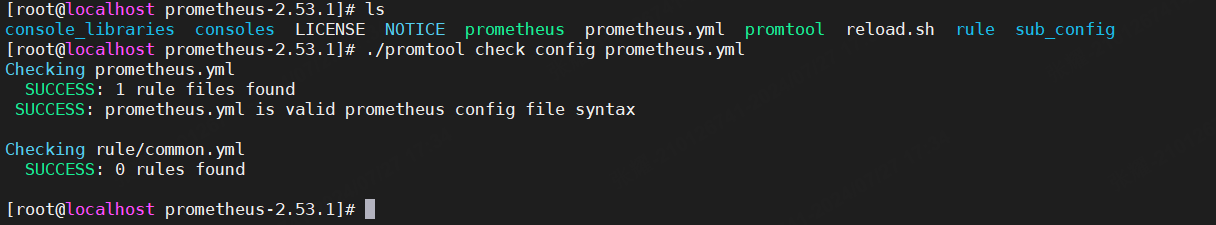
安装完成后,可以访问prometheus web地址,查看服务是否正常启动
二、node_exporter 安装部署
1、node_exporter下载
2、node_exporter安装
三、grafana 安装部署
1、安装部署grafana
2、制作重启grafana的脚本:
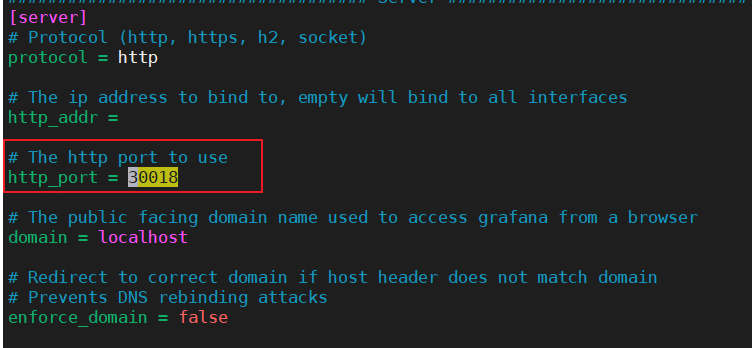
3、修改grafana的web端口号:
grafana的配置文件路径: ./conf/defaults.ini
进入文件找到server模块中修改http_port的参数即可
----------------------------以下无正文-------------------------
如果大家有运维技术问题,可扫描下方二维码进QQ群,一起沟通交流,提升技术。


 4609
4609

 被折叠的 条评论
为什么被折叠?
被折叠的 条评论
为什么被折叠?
 到【灌水乐园】发言


