


In the last years a lot of data has been released publicly in different formats, but sometimes the data we're interested in are still inside the HTML of a web page: let's see how to get those data.
One of the existing packages for doing this job is the XML package. This package allows us to read and create XML and HTML documents; among the many features, there's a function called readHTMLTable() that analyze the parsed HTML and returns the tables present in the page. The details of the package are available in the official documentation of the package.
Let's start.
Suppose we're interested in the italian demographic info present in this page http://sdw.ecb.europa.eu/browse.do?node=2120803 from the EU website. We start loading and parsing the page:
page
Now that we have parsed HTML, we can use the readHTMLTable() function to return a list with all the tables present in the page; we'll call the function with these parameters:
parsed: the parsed HTML
skip.rows: the rows we want to skip (at the beginning of this table there are a couple of rows that don't contain data but just formatting elements)
colClasses: the datatype of the different columns of the table (in our case all the columns have integer values); the rep() function is used to replicate 31 times the "integer" value
table
As we can see from the page source code, this web page contains six HTML tables; the one that contains the data we're interested in is the fifth, so we extract that one from the list of tables, as a data frame:
values
Just for convenience, we rename the columns with the period and italian data:
# renames the columns for the period and Italycolnames(values)[1]
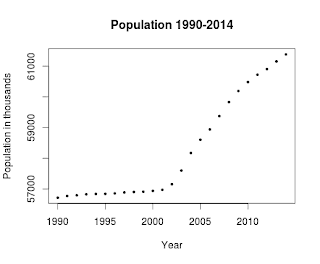
The italian data lasts from 1990 to 2014, so we have to subset only those rows and, of course, only the two columns of period and italian data:
# subsets the data: we are interested only in the first and the 19th column (period and italian info)ids
Now we can plot these data calling the plot function with these parameters:
ids: the data to plot
xlab: the label of the X axis
ylab: the label of the Y axis
main: the title of the plot
pch: the symbol to draw for evey point (19 is a solid circle: look here for an overview)
cex: the size of the symbol
plot(ids,xlab="Year",ylab="Population in thousands",main="Population 1990-2014",pch=19,cex=0.5)
and here is the result:
Here's the full code, also available on my github:
library(XML)# sets the URLurl
from: http://andreaiacono.blogspot.com/2014/01/scraping-data-from-web-pages-in-r-with.html


 被折叠的 条评论
为什么被折叠?
被折叠的 条评论
为什么被折叠?
 到【灌水乐园】发言


