


Overview
Here we present the ProTargetMiner concept. The overview of the project’s objectives is given in Fig. 1a. Employing the specificity concept (Fig. 1b), orthogonal partial least square-discriminant analysis (OPLS-DA) modeling (Fig. 1c) contrasts the proteome signature of a given compound against those of the rest of the compounds, which reveals the compound targets, MOA, effects on protein complexes and potential resistance factors. The workflow is given in Fig. 1d.
Fig. 1
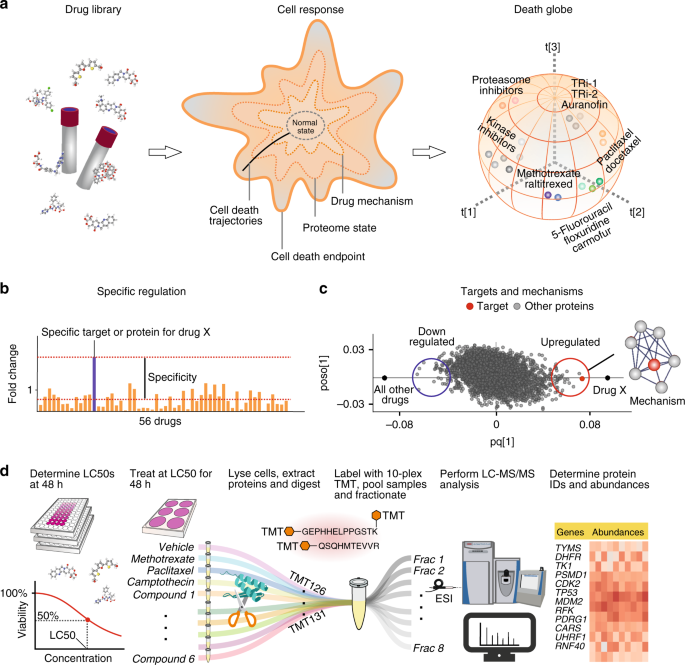
ProTargetMiner strategy and workflow. a an extensive proteome signature database of anticancer molecules will identify compounds with similar MOA in multidimensional space. b since the response of the target and mechanistic proteins to a compound is specific, c an OPLS-DA model contrasting the given compound with all other molecules in the database will identify the drug targets (red circles) and mechanistic proteins as specifically regulated proteins (among other proteins shown with gray circles). d workflow: determination of LC50 values for the library of compounds and selected cells; cell treatment with 56 compounds as well as vehicle-treated control and standard treatments (methotrexate, paclitaxel and camptothecin) in at least three biological replicates; lysis, digestion and labeling with TMT-10plex reagents; multiplexing the 10-plexed samples; fractionation of the pooled sample to increase the proteome coverage; analysis of individual fractions by LC-MS/MS; protein identification and relative quantification; data post-processing. The compound structures in panel a were taken from PubChem.
We selected A549 human lung adenocarcinoma cell line as a model system, because it is well covered in literature, and showed the highest sensitivity to selected compounds among the tested cell lines (MCF-7 and RKO). Viability measurements were performed for 118 clinical anticancer molecules selected from Selleckchem FDA-approved drug library together with several experimental anticancer compounds with unknown targets. A collection of 56 compounds with LC50 below 50 µM was chosen to treat the cells (at LC50 concentrations) for 48 h in three replicates. With the biological effect (cell death) being of the same magnitude, the differences in the proteome states could be attributable to the differences in targets and MOAs. This is in contrast to other databases, where fixed concentrations were used. The selected compounds belong to 19 different classes with versatile targets and MOAs, spanning 112 known targets curated from DrugBank (https://www.drugbank.ca/) in November 2019. These compounds and their known targets are listed in Supplementary Table 1. As standard drugs used for quality control, methotrexate, paclitaxel, and camptothecin were chosen and included in each TMT10 multiplexed proteomics experiment (labeling information is given in Supplementary Table 2).
For the main dataset, 287 proteomes were analyzed (10 conditions (compounds+controls) in 5 replicates in the first experiment+79 conditions in 3 replicates). Overall, to obtain the main dataset, 229 LC-MS/MS analyses were performed after multiplexing and fractionation. In total, 144,075 peptides were quantified, being attributed to 7,328 proteins with at least 2 unique peptides per protein. After selecting only proteins quantified with no missing values for 50 drugs, the list was reduced to 4,557 proteins (Supplementary Data 1) that were used in all subsequent analyses.
In each of the 9 multiplexed experiment for the original dataset, the compounds methotrexate, camptothecin and paclitaxel were included as controls, so that they can be used for data quality check. The Pearson correlation coefficient r for the average normalized intensities for the above drugs in different experiments was between 0.859 and 0.995 (only proteins with no missing values were used in this analysis), attesting to the quality of the proteomics data (Supplementary Fig. 1).
Due to the nature of random sampling of peptides in shotgun proteomics, the missing values cumulatively increase by merging several datasets, as not all proteins are quantified in all 9 experiments. The comparison of number of proteins, number of peptides, average sequence coverage and the number of missing values for the 9 experiments as well as for the merged original dataset is given in Supplementary Fig. 2.
Compound clusters, protein clusters, and their interactions
To reduce the number of dimensions and visualize the proteomic space, we employed a nonlinear dimension reduction method t-SNE that is widely used for projection of multidimensional molecular signatures3), we used the proximity of these points to evaluate the similarity of the drug-induced signatures. As expected, drugs with similar MOAs (e.g., tubulin inhibitors paclitaxel, docetaxel, vincristine, and 2-methodyestradiol; proteasome inhibitors b-AP15 and bortezomib
We found tomatine to be a gross outlier in principal component analysis (PCA) (Supplementary Fig. 4a). For tomatine, the total number of differentially regulated proteins with 1.5 and 2 fold cutoffs (vs. control) compared to the average of all other drugs was 9.4 and 14.6 fold higher, respectively. In Supplementary Fig. 4b, the number of differentially regulated proteins (fold change vs. control >2 and <0.5) for tomatine vs. other compounds is shown. Tomatine is likely to act via proteasome inhibition
PCA revealed 14 orthogonal dimensions contributing at least 1% to separation of proteome signatures (excluding tomatine) (Supplementary Fig. 5). The first 3 components are shown in Supplementary Fig. 6.
We next employed a conventional correlation-based hierarchical clustering analysis, in which the compounds aggregated in clusters mostly based on common targets/MOA (Fig. 2a). There are two super-clusters separating the compounds: one composed of the compounds that directly or indirectly lead to DNA damage, such as pyrimidine analogs, as well as TOP1 and TOP2 inhibitors, and the second super-cluster containing all the other molecules. The second super-cluster is in turn divided into proteasome inhibitors and the rest of molecules. This can be explained by dramatic accumulation of misfolded proteins or proteotoxicity of proteasome inhibitors7.
Fig. 2
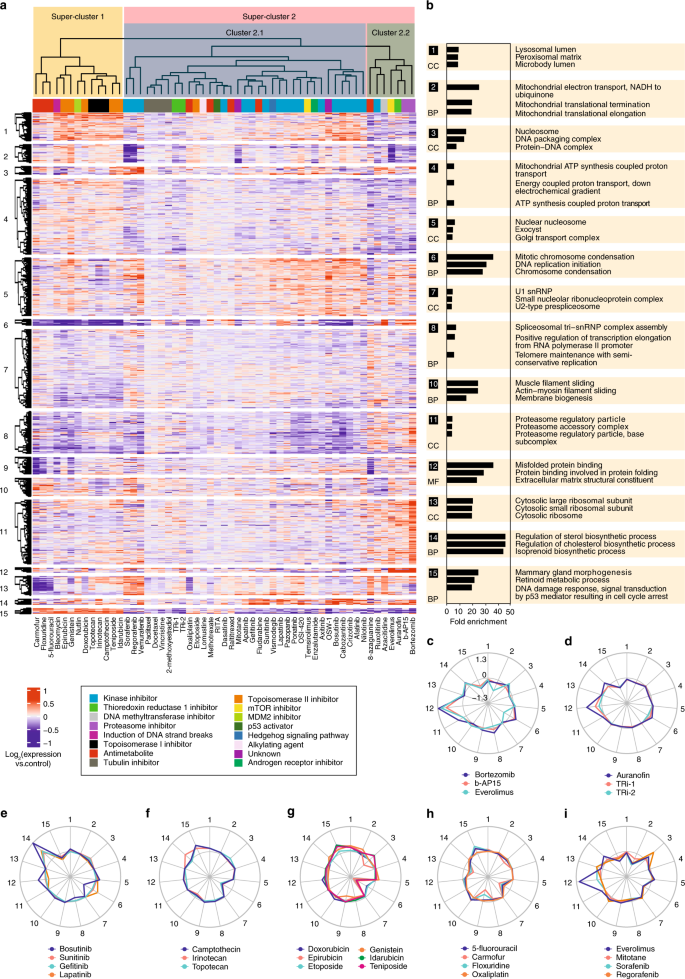
Hierarchical clustering of the proteome signatures by compounds and proteins. a compound clustering is largely consistent with their presumed MOAs (compound classes are denoted by colors). b top three most enriched gene ontology terms, representing either molecular function (MF), biological process (BP), or cellular component (CC). Cluster 9 that did not map to any specific GO term is omitted. c–i radar plots showing the clusters targeted by representative compounds. The distance from the center is proportional to the mean logarithm of fold change, and inner circle represents zero regulation. Panel a was made from Supplementary Data 1. Source data are provided as a Source Data file.
It must be noted that the a priori annotation of compounds is solely based on anticipated targets and disregards the off-targets effects, while proteome-based clustering is based on the overall change of the proteome. For example, auranofin clusters with b-AP15, consistent with its recently identified deubiquitinase inhibitor activity
We also performed clustering of proteins and identified 15 clusters (vertical axis in Fig. 2a), subjecting each cluster to Gene Ontology analysis (Supplementary Data 2 and Fig. 2b). Some of these clusters represent high density protein networks: e.g., cluster 13 maps to ribosome.
A quick look at the heat map in Fig. 2a reveals protein clusters due to which the compounds are placed in specific clusters. For example, the compounds in super-cluster 1 are separated from super-cluster 2 mostly due to the differences in protein clusters 6 and 15, which represent chromosome condensation and p53 signaling pathways, respectively. The DNA damaging agents lead to induction of p53 signaling pathway resulting in cell cycle arrest
Radar charts on Fig. 2c–i visualize the engagement of compound groups in different protein clusters. For example, proteasome inhibitors (and also everolimus) strongly induce cluster 12 related to protein folding (Fig. 2c), and so does auranofin, unlike other TXNRD1 inhibitors (Fig. 2d). Unexpectedly, some kinase inhibitors including lapatinib, bosutinib, sunitinib, and gefitinib up-regulate the (chole)sterol synthesis pathways, represented by cluster 14 in Fig. 2e. We later verify that these kinase inhibitors indeed enhance cellular cholesterol levels. TOP1 and TOP2A inhibitors down-regulate cluster 6 related to chromatin condensation (Fig. 2f, g). Also down-regulated are the ribosomal proteins (cluster 13) by pyrimidine analogs as well as oxaliplatin2h) and mitochondrial pathways (cluster 2) by a group of mitochondria-targeting compounds (Fig. 2i).
Functional discovery at the protein level
Protein regulation is usually defined as a ratio of the protein abundances in the cells incubated with a drug and a vehicle (control). However, many proteins are involved in generic, drug-unspecific cell responses (e.g., detoxification, death, or survival pathways). To reveal the protein responses characteristic to a particular drug, FITExP introduced specificity as a ratio of the protein regulation in response to a particular drug to the median regulation in response to all other drugs, and used it for deconvolution of drug target/MOA3a).
Fig. 3
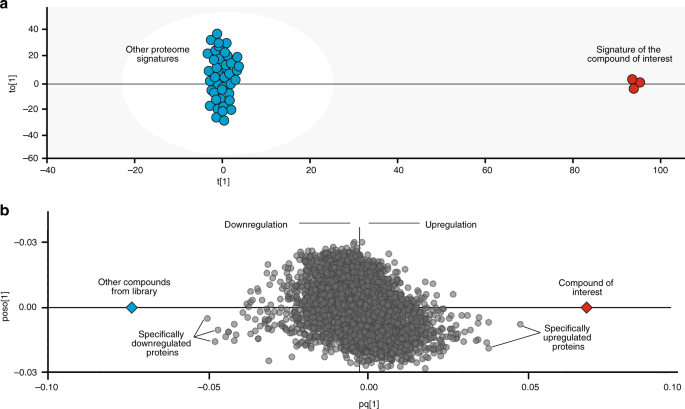
OPLS-DA paradigm. a a generalized OPLS-DA model contrasting a given compound proteome signature against all others. b the OPLS-DA loading or score scatter plot demonstrating proteins most contributing to class separation.
OPLS-DA is a multivariate data analysis tool and a supervised modeling approach that is useful for highlighting what makes two groups or systems different
In thus obtained OPLS-DA models, where each protein is represented by a dot on a loading plot, the proteins specifically up- or down-regulated in response to a given treatment are found on the opposite sides of the plot on the x axis (Fig. 3b). The proximity of a protein to the endpoint on either side of the x-axis reflects the magnitude and specificity of regulation of that protein in response to a given drug, taking into account the variation among the replicates. Since the y-axis coordinate reflects the contribution of the orthogonal components, the most specific target candidates are located near the x-axis.
Each OPSL-DA model is characterized by R2 value representing the goodness of the model fit. To avoid overfitting of the data in multivariate analysis, SIMCA employs leave-one-out cross-validation strategy. The result is the Q2 value, which is a measure of model predictive power. Q2 is also called the cross-validated R2 and should obviously have a smaller value. Therefore, a model with R2 of 1 perfectly describes the data, and the Q2 value of 1 indicates perfect predictivity of the model. In brief, for cross validation, the whole data-set is divided into seven groups and seven subsequent models are developed based on 6/7 of the data, leaving a new group aside each time
As representative examples of drug target deconvolution, OPLS-DA models for several drugs are shown in Fig. 4. R2 and Q2 values are given on each plot. The methotrexate target dihydrofolate reductase (DHFR) is convincingly identified as an obvious up-regulated outlier (p vs. control = 2E-5, two-sided Student’s t-test) (Fig. 4a). In SIMCA software, variable influence on projection (VIP) values can also be extracted from the model loading4b). Network analysis of the specifically regulated proteins on the either side of the model reflects compounds’ MOA. As an example, processes enriched for 30 top specifically up-regulated proteins in methotrexate treatment are deoxyribonucleoside monophosphate biosynthetic process (p
Fig. 4

ProTargetMiner reveals drug targets, action mechanisms, and affected cellular complexes. a OPLS-DA model for methotrexate. b variable influence on projection (VIP) values extracted from methotrexate OPLS-DA model. c–f OPLS-DA models for four other representative compounds (drug targets and/or mechanistic proteins are shown in red and dark blue circles). The mechanistically relevant pathway enrichment for the 30 most specifically up- or down-regulated proteins: GO processes for paclitaxel - mitotic cell cycle (p
Tubulins are found to be the most specifically up-regulated proteins for paclitaxel and down-regulated for vincristine, consistent with these two drugs affecting tubulin depolymerization4c, d).
If mechanistic proteins are engaged in large complexes, whole complexes can be specifically regulated. For example, the proteasome inhibitor bortezomib demonstrates specific up-regulation of the proteasome subunits (Fig. 4e). The sorafenib model shows specific down-regulation of NADH dehydrogenases and mitochondrial ribosomal proteins (Fig. 4f). This latter finding is in line with an earlier report for human neuroblastoma cells
The OPLS-DA derived x coordinates (specificity values) of each protein to each of the 55 tested compound are provided in Supplementary Data 3, and can serve as a reference resource in other studies, along with the expression data already presented in Supplementary Data 1.
The expression levels of the top proteins for different compounds are shown in Fig. 4g–j. For example, Fig. 4g shows the higher expression of tubulins identified through OPLS-DA in paclitaxel treatment vs. the average expression for all other drugs.
To further demonstrate the validity of the approach and to show what happens when no true signal is present, we removed the compounds-related columns in Fig. 4 from the dataset one by one (3 cases) and built OPLS-DA models with three randomly chosen (irrelevant) columns instead. The protein targets highlighted in Fig. 4 disappeared from the top ranking list, indicating that random selection of columns does not support meaningful findings (Supplementary Fig. 8).
Functional discovery on kinase inhibitors
As shown in Fig. 2, lapatinib, gefitinib, and other kinase inhibitors such as bosutinib, sunitinib, crizotinib, and cabozantinib affect cholesterol metabolism and/or lipid synthesis (representative OPLS-DA models and up-regulated proteins in Supplementary Fig. 9a, b, respectively). Literature seems to support these results. Lapatinib and crizotinib can induce cholesterol accumulation in human cardiomyocytes
To experimentally verify the effect of kinase inhibitors on cellular cholesterol levels, lapatinib, bosutinib, sunitinib, and gefitinib were tested, while sorafenib that did not induce up-regulation of lipid synthesis and/or cholesterol metabolism proteins, was used as a negative control. To avoid excessive cytotoxicity, we used a shorter incubation time of 20 h and a sub-LC50 concentration (4 µM) for all the compounds. A549, RKO, and human foreskin fibroblast (HFF-1) cells were used for the analysis. While all compounds increased the cellular total cholesterol levels by ~20–50% in A549 cells, in RKO cells, only lapatinib, gefitinib, and bosutinib had a similar effect, and in HFF-1 cells, only lapatinib and bosutinib enhanced the cholesterol levels. In short, the prediction made by ProTargetMiner was confirmed (Supplementary Fig. 9c). The potential contribution of this effect on the cytotoxicity of kinase inhibitors can be a subject for future studies.
Biochemical pathways affected by compounds are related not only to death pathways but also to cell survival10a) is known to be involved in resistance to this drug10a). AXL is a receptor tyrosine kinase regulating many aspects of cell proliferation and survival, and its overexpression induces resistance to EGFR targeted therapies10b), validating the ProTargetMiner prediction, that AXL might induce resistance to these drugs.
On the minimum size of ProTargetMiner
Since compound-induced effects can be cell-specific, detailed characterization of drug action is desirable in the most relevant biological setting. Thus in the drug development process it would be advantageous to build a ProTargetMiner dataset with a customized drug panel and cell type. Creating a ProTargetMiner de novo, however, could be time-consuming and expensive. Miniaturization of the experiment requires determination of the minimal compound panel size for deducing the target and MOA. To address this issue, PLS-DA models were built for different numbers of contrasting compounds (n = 1–54, 50 molecule combinations randomized for each n). The mean rankings of the known targets for representative compounds camptothecin, methotrexate, OSW-1 and paclitaxel were determined for each number of contrasting drugs n. As expected, higher n gave better ranking for drug targets but not for random proteins (Fig. 5). Encouragingly, already 8–10 contrasting molecules in the drug panel were in most cases enough for target rankings reaching a value below 10. This would present an opportunity to miniaturize ProTargetMiner for specialized applications, as well as reducing the labor and cost of the analyses.
Fig. 5
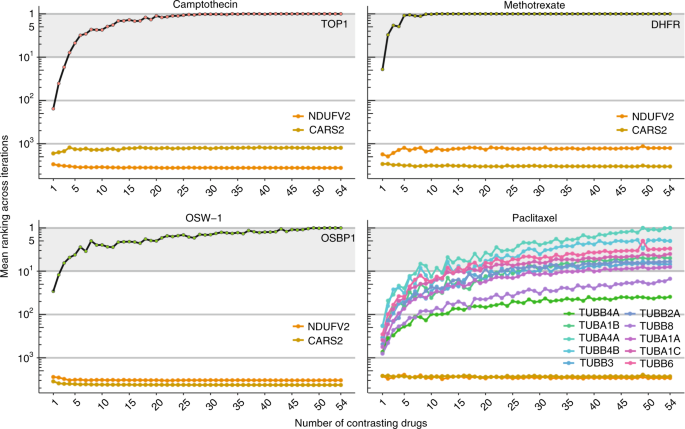
Determination of the ProTargetMiner minimal size. Four compounds were contrasted against 50 random combinations of 1–54 compounds by PLS-DA modeling and the mean drug target ranking was calculated for each number. NDUFV2 and CARS2 proteins were randomly chosen as non-target proteins. Supplementary Data 1 was used for production of this figure.
ProTargetMiner size vs. proteome depth
A miniaturized ProTargetMiner dataset could offer a deeper proteome coverage with less missing values. We obtained deeper proteomic datasets for A549, MCF-7, and RKO cells representing major cancer types (lung, breast, and colon cancers, respectively) (Supplementary Data 4–6). As a drug panel, 9 molecules were chosen representing most diverse MOAs according to drug clustering in Fig. 2a as well as different orthogonal dimensions in the factor analysis of that dataset: 8-azaguanine (target: PNP), raltitrexed (target: TYMS), topotecan (target: TOP1), floxuridine (target: TYMS), nutlin (target: MDM2), dasatinib (target: multiple kinase targets), gefitinib (target: EGFR), vincristine (target: tubulin), and bortezomib (PSMB5 and PSMB1). While in the original dataset, samples were analyzed in 8 fractions, for obtaining deep datasets samples were fractionated into 16 (A549), 23 (MCF-7), or 24 (RKO), and the resulting fractions were analyzed using the Q Exactive HF mass spectrometer. The depths of the proteome profiles are 7398, 8735, and 8551 proteins, respectively, with no missing values in all three replicates. The comparison of number of proteins, number of peptides, average sequence coverage, and the number of missing values is given in Supplementary Fig. 11.
To showcase the applicability of the new deep datasets in target deconvolution, OPLS-DA models were built for the kinase inhibitor dasatinib vs. eight other treatments in each cell line (Fig. 6a). Comparison of the models revealed both similarities and cell-specific differences. As an example, the known target MAPK14 and the previously unknown target candidate PARG (Poly(ADP-ribose) glycohydrolase) were among the top target candidates in all three cell lines, while the other known kinase targets only appeared in certain cell lines (Fig. 6a). Dasatinib potently inhibits several tyrosine kinases, of which only 4 kinases including SRC, YES1, CSK, and LYN were among the top proteins in different cell lines. This is while the OPLS-DA model highlights other previously unknown kinases as potential targets. Interestingly, CYP1A1 which is involved in dasatinib metabolism6a). Similarly, the known targets for bortezomib dipeptidyl peptidase 2 (DPP7) and DPP36b), but not in the other two cell lines. These datasets could provide a platform for merging user data.
Fig. 6
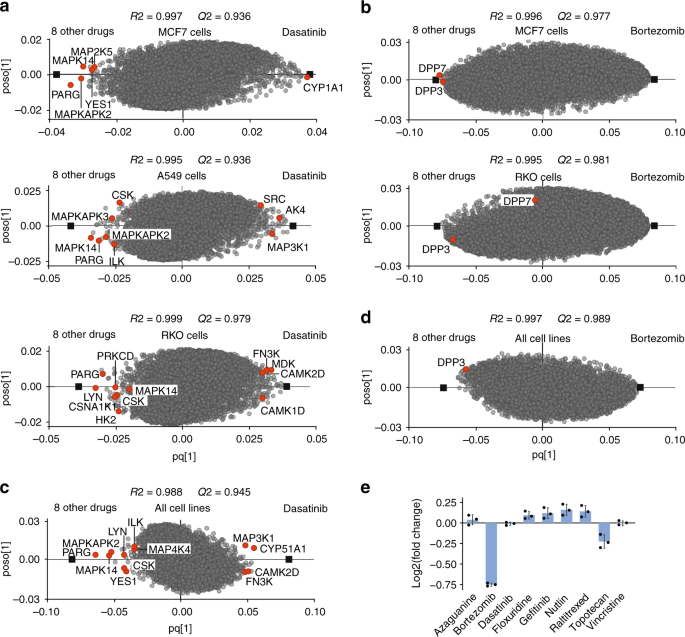
Deeper ProTargetMiner dataset with 8 contrasting compounds is successful in target/MOA deconvolution. a OPLS-DA enabled deconvolution of multiple kinases as targets for dasatinib in three cell lines (drug targets shown in red circles). b deconvolution of DPP7 and DPP3 in MCF-7 and DPP3 in RKO cells. In A549 cells, these targets were not among the top 100 proteins. c identification of multiple targets for dasatinib in the merged dataset from three cell lines. d merging all cell lines shows that DPP3 is a common bortezomib target. Moreover, protein ubiquitination was the top GO term for 30 up-regulated proteins for bortezomib (11/30 proteins, p
Merging deep datasets to obtain common drug targets and MOA
In a previous study we have shown that a merged OPLS-DA model built for the proteomes of three cell lines perturbed by different drugs possesses an interesting property – it is rigid, meaning that such models created for a subset encompassing ≥500 most abundant proteins are very similar to the models encompassing ≈100 most drug-specific proteins
The combined deep-proteome dataset has a total depth of 11,293 proteins quantified with at least two peptides, of which 6496 proteins were common in all cell lines and without missing values (Supplementary Data 7). Compared to individual cell datasets, the merged model built for these proteins possesses higher specificity. For instance, for dasatinib, the known targets become more significant outliers (Fig. 6c).
On the other hand, some well-known targets faded in ranking, likely due to the cell-specific mechanistic differences. This phenomenon was noted for some kinases for dasatinib (Fig. 6c) and for DPP7 and DPP3 proteins for bortezomib (Fig. 6d). As an example, the expression of DPP3 in MCF-7 cells has been shown in Fig. 6e. Similarly, tubulins which had high rankings in MCF-7 and A549 cells in response to vincristine (3 tubulins were among the top 10 specifically down-regulated proteins in both cell lines), were not among the top proteins in RKO cells. As a result, top proteins for vincristine in the merged dataset had only two tubulins. On the other hand, the top 30 specifically down-regulated proteins for vincristine in the merged dataset, mapped very well to rRNA processing (p
Making an expandable public platform
The ProTargetMiner datasets can be easily extended with new data on other compounds. In order to make the resource available to the community, a Shiny package was written in R, providing a user interface for data integration and PLS-DA modeling for either a selected cell line or all cell lines (Fig. 7a). In short, the user obtains the proteome signature of the desired compound at LC50 concentration (48 h treatment) in any, or all, of the above cell lines in form of the gene names and fold changes in preferably three replicates (only 6 proteomics analyses per cell line), and uploads this information (as an own dataset) through a user interface according to the step-by-step procedure given in Fig. 7b. A template for the input.CSV file is shown in Fig. 7c. The package output will be the loading values of top specifically regulated proteins extracted from a PLS-DA model contrasting the given compound against the 9 diverse proteome signatures in that cell line (or all cell lines).
Fig. 7
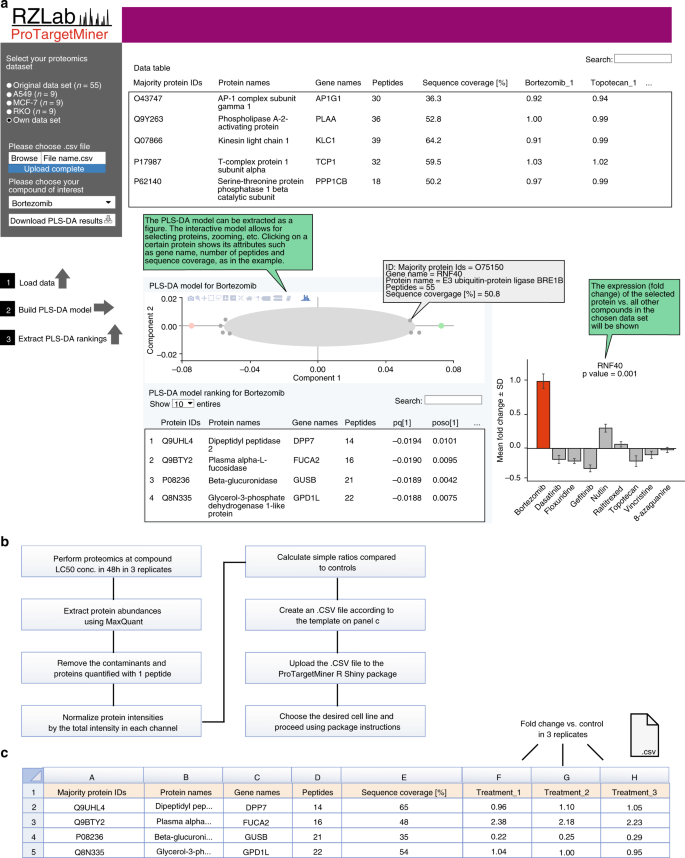
The ProTargetMiner R Shiny package for deconvolution of drug target and MOA. a the ProTargetMiner R Shiny package interface. The input is the proteomics data for a desired compound and the output is the .CSV file containing the ranking of proteins for the compound against the desired panel in a PLS-DA model. Clicking on the interactive PLS-DA plot gives the attributes of the selected proteins, e.g. name, number of peptides, sequence coverage and significance compared to control, and will show the regulation of that protein in the compound panel. b step-by-step procedure of the use of ProTargetMiner R Shiny package. c the input .CSV template with the required columns.


 752
752


 被折叠的 条评论
为什么被折叠?
被折叠的 条评论
为什么被折叠?
 到【灌水乐园】发言


