


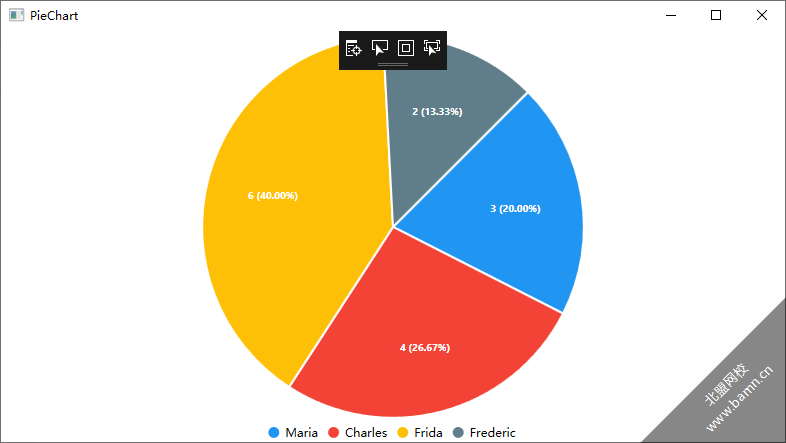
饼状图
看例子代码
xmlns="http://schemas.microsoft.com/winfx/2006/xaml/presentation"
xmlns:x="http://schemas.microsoft.com/winfx/2006/xaml"
xmlns:d="http://schemas.microsoft.com/expression/blend/2008"
xmlns:mc="http://schemas.openxmlformats.org/markup-compatibility/2006"
xmlns:local="clr-namespace:WpfApp4"
xmlns:lvc="clr-namespace:LiveCharts.Wpf;assembly=LiveCharts.Wpf"
mc:Ignorable="d"
Title="PieChart" Height="450" Width="800">
LabelPoint="{Binding PointLabel}"/>
LabelPoint="{Binding PointLabel}"/>
LabelPoint="{Binding PointLabel}"/>
LabelPoint="{Binding PointLabel}"/>
后台cs代码using LiveCharts;
using LiveCharts.Wpf;
using System;
using System.Collections.Generic;
using System.Linq;
using System.Text;
using System.Threading.Tasks;
using System.Windows;
using System.Windows.Controls;
using System.Windows.Data;
using System.Windows.Documents;
using System.Windows.Input;
using System.Windows.Media;
using System.Windows.Media.Imaging;
using System.Windows.Shapes;
namespace WpfApp4
{
///
/// PieChart.xaml 的交互逻辑
///
public partial class PieChart : Window
{
public PieChart()
{
InitializeComponent();
PointLabel = chartPoint =>
string.Format("{0} ({1:P})", chartPoint.Y, chartPoint.Participation);
DataContext = this;
}
public Func PointLabel { get; set; }
private void Chart_OnDataClick(object sender, ChartPoint chartpoint)
{
var chart = (LiveCharts.Wpf.PieChart)chartpoint.ChartView;
//clear selected slice.
foreach (PieSeries series in chart.Series)
series.PushOut = 0;
var selectedSeries = (PieSeries)chartpoint.SeriesView;
selectedSeries.PushOut = 8;
}
}
}


 115
115


 被折叠的 条评论
为什么被折叠?
被折叠的 条评论
为什么被折叠?
 到【灌水乐园】发言


