


mkdir -p /mnt/storage/prom/{prometheus,prometheus/data,alertmanager,grafana}

chmod 777 /mnt/storage/prom/{prometheus/data,grafana}

cd /mnt/storage/prom
Prometheus
vim /mnt/storage/prom/prometheus/alert-rules.yml
groups:
  - name: node-alert
    rules:
    - alert: NodeDown
      expr: up{job="node"} == 0
      for: 5m
      labels:
        severity: critical
        instance: "{{ $labels.instance }}"
      annotations:
        summary: "instance: {{ $labels.instance }} down"
        description: "Instance: {{ $labels.instance }} 已经宕机 5分钟"
        value: "{{ $value }}"

    - alert: NodeCpuHigh
      expr: (1 - avg by (instance) (irate(node_cpu_seconds_total{job="node",mode="idle"}[5m]))) * 100 > 85
      for: 5m
      labels:
        severity: warning
        instance: "{{ $labels.instance }}"
      annotations:
        summary: "instance: {{ $labels.instance }} cpu使用率过高"
        description: "CPU 使用率超过 80%"
        value: "{{ $value }}"

    - alert: NodeCpuIowaitHigh
      expr: avg by (instance) (irate(node_cpu_seconds_total{job="node",mode="iowait"}[5m])) * 100 > 80
      for: 5m
      labels:
        severity: warning
        instance: "{{ $labels.instance }}"
      annotations:
        summary: "instance: {{ $labels.instance }} cpu iowait 使用率过高"
        description: "CPU iowait 使用率超过 50%"
        value: "{{ $value }}"

    - alert: NodeLoad5High
      expr: node_load5 > (count by (instance) (node_cpu_seconds_total{job="node",mode='system'})) * 1.2
      for: 5m
      labels:
        severity: warning
        instance: "{{ $labels.instance }}"
      annotations:
        summary: "instance: {{ $labels.instance }} load(5m) 过高"
        description: "Load(5m) 过高,超出cpu核数 1.2倍"
        value: "{{ $value }}"

    - alert: NodeMemoryHigh
      expr: (1 - node_memory_MemAvailable_bytes{job="node"} / node_memory_MemTotal_bytes{job="node"}) * 100 > 90
      for: 5m
      labels:
        severity: warning
        instance: "{{ $labels.instance }}"
      annotations:
        summary: "instance: {{ $labels.instance }} memory 使用率过高"
        description: "Memory 使用率超过 90%"
        value: "{{ $value }}"

    - alert: NodeDiskRootHigh
      expr: (1 - node_filesystem_avail_bytes{job="node",fstype=~"ext.*|xfs",mountpoint ="/"} / node_filesystem_size_bytes{job="node",fstype=~"ext.*|xfs",mountpoint ="/"}) * 100 > 90
      for: 10m
      labels:
        severity: warning
        instance: "{{ $labels.instance }}"
      annotations:
        summary: "instance: {{ $labels.instance }} disk(/ 分区) 使用率过高"
        description: "Disk(/ 分区) 使用率超过 90%"
        value: "{{ $value }}"

    - alert: NodeDiskBootHigh
      expr: (1 - node_filesystem_avail_bytes{job="node",fstype=~"ext.*|xfs",mountpoint ="/boot"} / node_filesystem_size_bytes{job="node",fstype=~"ext.*|xfs",mountpoint ="/boot"}) * 100 > 80
      for: 10m
      labels:
        severity: warning
        instance: "{{ $labels.instance }}"
      annotations:
        summary: "instance: {{ $labels.instance }} disk(/boot 分区) 使用率过高"
        description: "Disk(/boot 分区) 使用率超过 80%"
        value: "{{ $value }}"

    - alert: NodeDiskReadHigh
      expr: irate(node_disk_read_bytes_total{job="node"}[5m]) > 20 * (1024 ^ 2)
      for: 5m
      labels:
        severity: warning
        instance: "{{ $labels.instance }}"
      annotations:
        summary: "instance: {{ $labels.instance }} disk 读取字节数 速率过高"
        description: "Disk 读取字节数 速率超过 20 MB/s"
        value: "{{ $value }}"

    - alert: NodeDiskWriteHigh
      expr: irate(node_disk_written_bytes_total{job="node"}[5m]) > 20 * (1024 ^ 2)
      for: 5m
      labels:
        severity: warning
        instance: "{{ $labels.instance }}"
      annotations:
        summary: "instance: {{ $labels.instance }} disk 写入字节数 速率过高"
        description: "Disk 写入字节数 速率超过 20 MB/s"
        value: "{{ $value }}"

    - alert: NodeDiskReadRateCountHigh
      expr: irate(node_disk_reads_completed_total{job="node"}[5m]) > 3000
      for: 5m
      labels:
        severity: warning
        instance: "{{ $labels.instance }}"
      annotations:
        summary: "instance: {{ $labels.instance }} disk iops 每秒读取速率过高"
        description: "Disk iops 每秒读取速率超过 3000 iops"
        value: "{{ $value }}"

    - alert: NodeDiskWriteRateCountHigh
      expr: irate(node_disk_writes_completed_total{job="node"}[5m]) > 3000
      for: 5m
      labels:
        severity: warning
        instance: "{{ $labels.instance }}"
      annotations:
        summary: "instance: {{ $labels.instance }} disk iops 每秒写入速率过高"
        description: "Disk iops 每秒写入速率超过 3000 iops"
        value: "{{ $value }}"

    - alert: NodeInodeRootUsedPercentHigh
      expr: (1 - node_filesystem_files_free{job="node",fstype=~"ext4|xfs",mountpoint="/"} / node_filesystem_files{job="node",fstype=~"ext4|xfs",mountpoint="/"}) * 100 > 80
      for: 10m
      labels:
        severity: warning
        instance: "{{ $labels.instance }}"
      annotations:
        summary: "instance: {{ $labels.instance }} disk(/ 分区) inode 使用率过高"
        description: "Disk (/ 分区) inode 使用率超过 80%"
        value: "{{ $value }}"

    - alert: NodeInodeBootUsedPercentHigh
      expr: (1 - node_filesystem_files_free{job="node",fstype=~"ext4|xfs",mountpoint="/boot"} / node_filesystem_files{job="node",fstype=~"ext4|xfs",mountpoint="/boot"}) * 100 > 80
      for: 10m
      labels:
        severity: warning
        instance: "{{ $labels.instance }}"
      annotations:
        summary: "instance: {{ $labels.instance }} disk(/boot 分区) inode 使用率过高"
        description: "Disk (/boot 分区) inode 使用率超过 80%"
        value: "{{ $value }}"

    - alert: NodeFilefdAllocatedPercentHigh
      expr: node_filefd_allocated{job="node"} / node_filefd_maximum{job="node"} * 100 > 80
      for: 10m
      labels:
        severity: warning
        instance: "{{ $labels.instance }}"
      annotations:
        summary: "instance: {{ $labels.instance }} filefd 打开百分比过高"
        description: "Filefd 打开百分比 超过 80%"
        value: "{{ $value }}"

    - alert: NodeNetworkNetinBitRateHigh
      expr: avg by (instance) (irate(node_network_receive_bytes_total{device=~"eth0|eth1|ens33|ens37"}[1m]) * 8) > 20 * (1024 ^ 2) * 8
      for: 3m
      labels:
        severity: warning
        instance: "{{ $labels.instance }}"
      annotations:
        summary: "instance: {{ $labels.instance }} network 接收比特数 速率过高"
        description: "Network 接收比特数 速率超过 20MB/s"
        value: "{{ $value }}"

    - alert: NodeNetworkNetoutBitRateHigh
      expr: avg by (instance) (irate(node_network_transmit_bytes_total{device=~"eth0|eth1|ens33|ens37"}[1m]) * 8) > 20 * (1024 ^ 2) * 8
      for: 3m
      labels:
        severity: warning
        instance: "{{ $labels.instance }}"
      annotations:
        summary: "instance: {{ $labels.instance }} network 发送比特数 速率过高"
        description: "Network 发送比特数 速率超过 20MB/s"
        value: "{{ $value }}"

    - alert: NodeNetworkNetinPacketErrorRateHigh
      expr: avg by (instance) (irate(node_network_receive_errs_total{device=~"eth0|eth1|ens33|ens37"}[1m])) > 15
      for: 3m
      labels:
        severity: warning
        instance: "{{ $labels.instance }}"
      annotations:
        summary: "instance: {{ $labels.instance }} 接收错误包 速率过高"
        description: "Network 接收错误包 速率超过 15个/秒"
        value: "{{ $value }}"

    - alert: NodeNetworkNetoutPacketErrorRateHigh
      expr: avg by (instance) (irate(node_network_transmit_packets_total{device=~"eth0|eth1|ens33|ens37"}[1m])) > 15
      for: 3m
      labels:
        severity: warning
        instance: "{{ $labels.instance }}"
      annotations:
        summary: "instance: {{ $labels.instance }} 发送错误包 速率过高"
        description: "Network 发送错误包 速率超过 15个/秒"
        value: "{{ $value }}"

    - alert: NodeProcessBlockedHigh
      expr: node_procs_blocked{job="node"} > 10
      for: 10m
      labels:
        severity: warning
        instance: "{{ $labels.instance }}"
      annotations:
        summary: "instance: {{ $labels.instance }} 当前被阻塞的任务的数量过多"
        description: "Process 当前被阻塞的任务的数量超过 10个"
        value: "{{ $value }}"

    - alert: NodeTimeOffsetHigh
      expr: abs(node_timex_offset_seconds{job="node"}) > 3 * 60
      for: 2m
      labels:
        severity: info
        instance: "{{ $labels.instance }}"
      annotations:
        summary: "instance: {{ $labels.instance }} 时间偏差过大"
        description: "Time 节点的时间偏差超过 3m"
        value: "{{ $value }}"
vim /mnt/storage/prom/prometheus/prometheus.yml
global:
  scrape_interval:     15s
  evaluation_interval: 15s

alerting:
  alertmanagers:
  - static_configs:
    - targets:
      - alertmanager:9093

rule_files:
  - "*rules.yml"

scrape_configs:
  - job_name: 'prometheus'
    static_configs:
    - targets: ['prometheus:9090']

  - job_name: 'node'
    static_configs:
    - targets: ['node-exporter:9100']

  - job_name: 'alertmanager'
    static_configs:
    - targets: ['alertmanager:9093']
Alertmanager
vim /mnt/storage/prom/alertmanager/config.yml
targets:
  webhook:
    url: https://oapi.dingtalk.com/robot/send?access_token=xxxxxxxxxxxx             #修改为钉钉机器人的webhook
    mention:
      all: true
vim /mnt/storage/prom/alertmanager/alertmanager.yml
global:
  resolve_timeout: 5m
  smtp_smarthost: 'smtp.qiye.163.com:465'             #邮箱smtp服务器代理,启用SSL发信, 端口一般是465
  smtp_from: 'user@163.com'              #发送邮箱名称
  smtp_auth_username: 'user@163.com'              #邮箱名称
  smtp_auth_password: 'password'                #邮箱密码或授权码
  smtp_require_tls: false

route:
  receiver: 'default'
  group_wait: 10s
  group_interval: 1m
  repeat_interval: 1h
  group_by: ['alertname']

inhibit_rules:
- source_match:
    severity: 'critical'
  target_match:
    severity: 'warning'
  equal: ['alertname', 'instance']

receivers:
- name: 'default'
  email_configs:
  - to: 'receiver@163.com'
    send_resolved: true
  webhook_configs:
  - url: 'http://dingtalk:8060/dingtalk/webhook/send'
    send_resolved: true
准备工作完成,现在写docker-compose.yml
vim /mnt/storage/prom/docker-compose.yml
version: '3.7'

services:
  node-exporter:
    image: prom/node-exporter:latest
    ports:
      - "9100:9100"
    networks:
      - prom

  dingtalk:
    image: timonwong/prometheus-webhook-dingtalk:latest
    volumes:
      - type: bind
        source: ./alertmanager/config.yml
        target: /etc/prometheus-webhook-dingtalk/config.yml
        read_only: true
    ports:
      - "8060:8060"
    networks:
      - prom

  alertmanager:
    depends_on:
      - dingtalk
    image: prom/alertmanager:latest
    volumes:
      - type: bind
        source: ./alertmanager/alertmanager.yml
        target: /etc/alertmanager/alertmanager.yml
        read_only: true
    ports:
      - "9093:9093"
      - "9094:9094"
    networks:
      - prom

  prometheus:
    depends_on:
      - alertmanager
    image: prom/prometheus:latest
    volumes:
      - type: bind
        source: ./prometheus/prometheus.yml
        target: /etc/prometheus/prometheus.yml
        read_only: true
      - type: bind
        source: ./prometheus/alert-rules.yml
        target: /etc/prometheus/alert-rules.yml
        read_only: true
      - type: volume
        source: prometheus
        target: /prometheus
    ports:
      - "9090:9090"
    networks:
      - prom

  grafana:
    depends_on:
      - prometheus
    image: grafana/grafana:latest
    volumes:
      - type: volume
        source: grafana
        target: /var/lib/grafana
    ports:
      - "3000:3000"
    networks:
      - prom

volumes:
  prometheus:
    driver: local
    driver_opts:
      type: none
      o: bind
      device: /mnt/storage/prom/prometheus/data
  grafana:
    driver: local
    driver_opts:
      type: none
      o: bind
      device: /mnt/storage/prom/grafana

networks:
  prom:
    driver: bridge
docker-compose up -d

docker-compose ps

        Name                      Command               State                       Ports
--------------------------------------------------------------------------------------------------------------
prom_alertmanager_1    /bin/alertmanager --config ...   Up      0.0.0.0:9093->9093/tcp, 0.0.0.0:9094->9094/tcp
prom_dingtalk_1        /bin/prometheus-webhook-di ...   Up      0.0.0.0:8060->8060/tcp
prom_grafana_1         /run.sh                          Up      0.0.0.0:3000->3000/tcp
prom_node-exporter_1   /bin/node_exporter               Up      0.0.0.0:9100->9100/tcp
prom_prometheus_1      /bin/prometheus --config.f ...   Up      0.0.0.0:9090->9090/tcp

docker ps

CONTAINER ID        IMAGE                                          COMMAND                  CREATED             STATUS              PORTS                              NAMES
c1ec4cc9c41f        grafana/grafana:latest                         "/run.sh"                36 seconds ago      Up 36 seconds       0.0.0.0:3000->3000/tcp             prom_grafana_1
8cd521c327d8        prom/prometheus:latest                         "/bin/prometheus --c…"   37 seconds ago      Up 36 seconds       0.0.0.0:9090->9090/tcp             prom_prometheus_1
ef93c8c06ca0        prom/alertmanager:latest                       "/bin/alertmanager -…"   37 seconds ago      Up 37 seconds       0.0.0.0:9093-9094->9093-9094/tcp   prom_alertmanager_1
d358a2a39b8d        timonwong/prometheus-webhook-dingtalk:latest   "/bin/prometheus-web…"   38 seconds ago      Up 37 seconds       0.0.0.0:8060->8060/tcp             prom_dingtalk_1
366ff81e7a65        prom/node-exporter:latest                      "/bin/node_exporter"     38 seconds ago      Up 37 seconds       0.0.0.0:9100->9100/tcp             prom_node-exporter_1
ip:3000 进入granafa
granafa首次登录账户名和密码admin/admin,可以修改
配置数据源Data sources->Add data source -> Prometheus,输入prometheus数据源的信息,主要是输入name和url

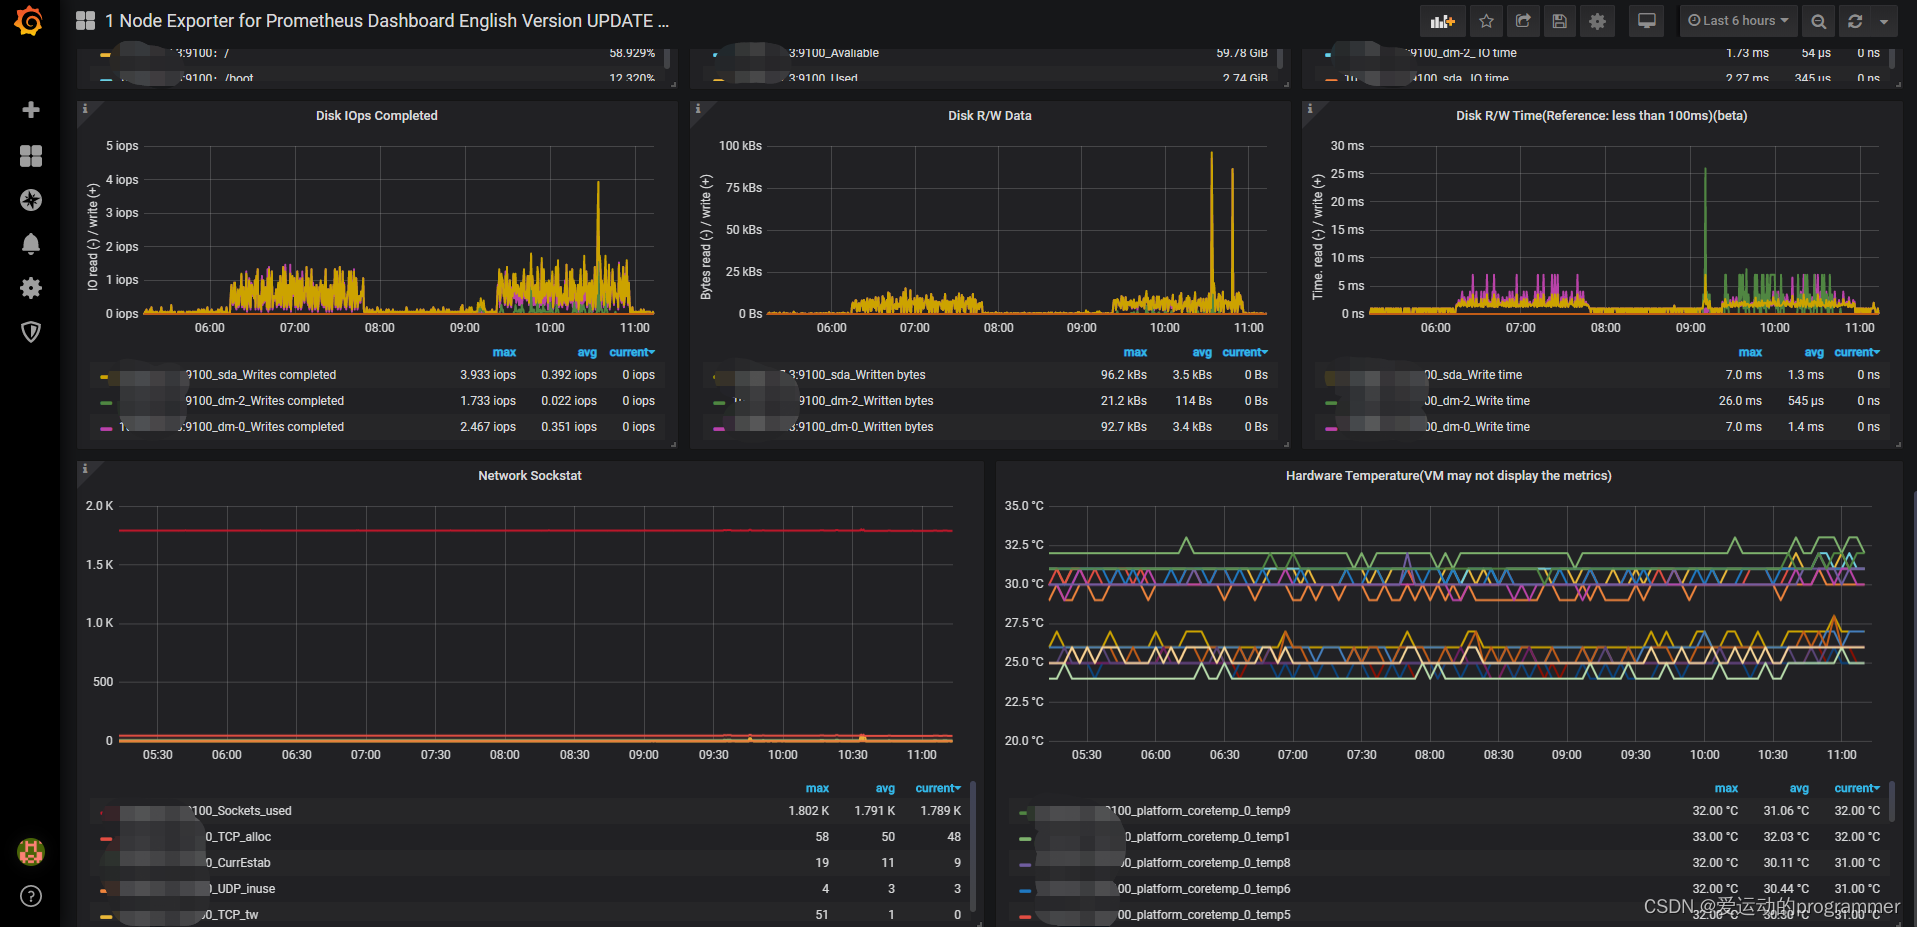
添加 Dashboard -> New Dashboard -> Import Dashboard -> 输入11074,导入Linux监控模板. 并配置数据源为Prometheus,即上一步中的name
配置完保存后即可看到逼格非常高的系统主机节点监控信息,包括系统运行时间, 内存和CPU的配置, CPU、内存、磁盘、网络流量等信息, 以及磁盘IO、CPU温度等信息。


 1757
1757


 被折叠的 条评论
为什么被折叠?
被折叠的 条评论
为什么被折叠?
 到【灌水乐园】发言


