组件代码
import React, { Component } from 'react'
import echarts from 'echarts'
class LineEcharts extends Component {
constructor(props) {
super(props)
this.state = {
}
}
componentDidMount() {
setTimeout(() => {
this.initEchart(this.props.data)
}, 200)
}
componentWillReceiveProps(newProps) {
this.initEchart(newProps.data)
}
initEchart = (data) => {
let myEcharts = echarts.init(this.echartsBox)
let option = {
title: {
text: this.props.title || '',
left: 'center',
top: '0'
},
tooltip: {
show: true,
trigger: 'axis',
axisPointer: {
type: 'cross',
label: {
show: false
}
},
formatter: '{b}<br/>汇总:{c}',
extraCssText: 'box-shadow: 0 0 3px rgba(0, 0, 0, 0.3);'
},
xAxis: {
data: data.x,
axisTick: {
alignWithLabel: true
}
},
yAxis: {
name: this.props.yname,
nameGap: 15,
position: 'left',
axisTick: {
inside: true
},
axisLabel: {
formatter: '{value}'
}
},
series: [{
name: '汇总',
type: 'line',
data: data.y,
smooth: false,
lineStyle: {
color: '#00CC99',
width: 2
},
itemStyle: {
color: '#fff',
borderColor: '#000'
}
}]
}
myEcharts.setOption(option)
myEcharts.on('finished', () => {
myEcharts.resize()
})
}
render() {
return (
<div ref={(c) => { this.echartsBox = c }} style={{ width: '100%', height: '100%' }} />
)
}
}
export default LineEcharts
使用时
import React, { Component } from 'react'
import LineEcharts from '../components/LineEcharts/index'
class LineEchartsDemo extends Component{
constructor(props) {
super(props)
this.state = {
data: {
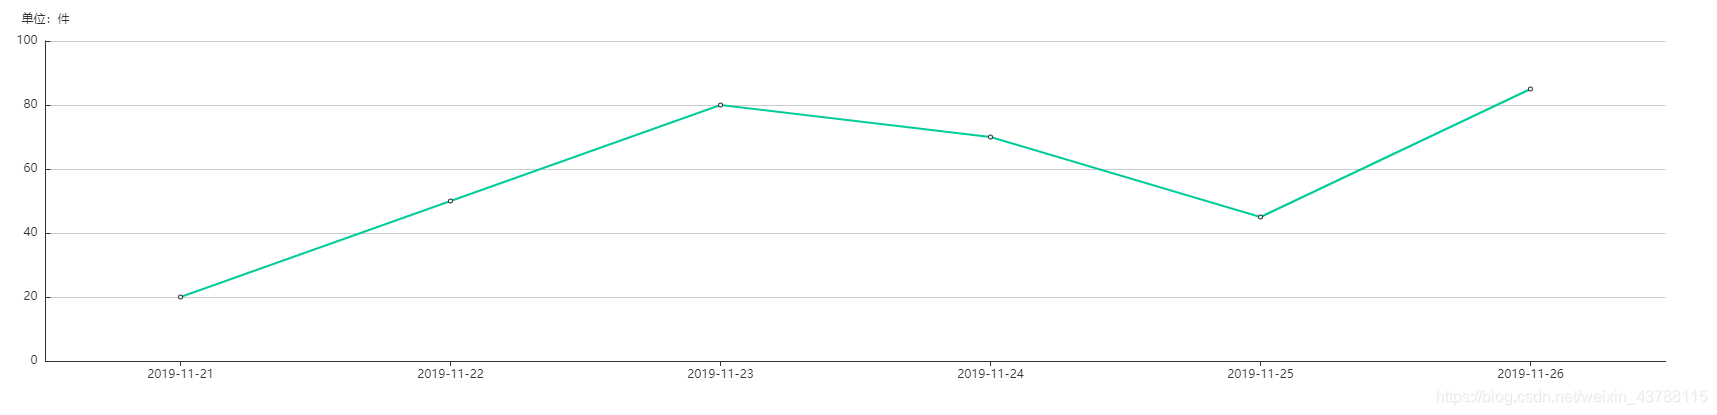
x: ['2019-11-21', '2019-11-22', '2019-11-23', '2019-11-24', '2019-11-25', '2019-11-26'],
y: [20, 50, 80, 70, 45, 85]
}
}
}
componentDidMount() { }
render() {
<LineEcharts data={this.state.data} yname="单位:件" />
}
}
export default LineEchartsDemo
效果


 381
381


 被折叠的 条评论
为什么被折叠?
被折叠的 条评论
为什么被折叠?
 到【灌水乐园】发言


