


自然语言处理实例
数据简介: Disasters on social media
社交媒体上有些讨论是关于灾难,疾病,暴乱的,有些只是开玩笑或者是电影情节,我们该如何让机器能分辨出这两种讨论呢?

import keras
import nltk
import pandas as pd
import numpy as np
import re
import codecs

questions = pd.read_csv("socialmedia_relevant_cols_clean.csv")
questions.columns=['text', 'choose_one', 'class_label']
questions.head()
| text | choose_one | class_label | |
|---|---|---|---|
| 0 | Just happened a terrible car crash | Relevant | 1 |
| 1 | Our Deeds are the Reason of this #earthquake M... | Relevant | 1 |
| 2 | Heard about #earthquake is different cities, s... | Relevant | 1 |
| 3 | there is a forest fire at spot pond, geese are... | Relevant | 1 |
| 4 | Forest fire near La Ronge Sask. Canada | Relevant | 1 |
questions.describe()
| class_label | |
|---|---|
| count | 10876.000000 |
| mean | 0.432604 |
| std | 0.498420 |
| min | 0.000000 |
| 25% | 0.000000 |
| 50% | 0.000000 |
| 75% | 1.000000 |
| max | 2.000000 |
数据清洗,去掉无用字符
def standardize_text(df, text_field):
    df[text_field] = df[text_field].str.replace(r"http\S+", "")
    df[text_field] = df[text_field].str.replace(r"http", "")
    df[text_field] = df[text_field].str.replace(r"@\S+", "")
    df[text_field] = df[text_field].str.replace(r"[^A-Za-z0-9(),!?@\'\`\"\_\n]", " ")
    df[text_field] = df[text_field].str.replace(r"@", "at")
    df[text_field] = df[text_field].str.lower()
    return df

questions = standardize_text(questions, "text")

questions.to_csv("clean_data.csv")
questions.head()
| text | choose_one | class_label | |
|---|---|---|---|
| 0 | just happened a terrible car crash | Relevant | 1 |
| 1 | our deeds are the reason of this earthquake m... | Relevant | 1 |
| 2 | heard about earthquake is different cities, s... | Relevant | 1 |
| 3 | there is a forest fire at spot pond, geese are... | Relevant | 1 |
| 4 | forest fire near la ronge sask canada | Relevant | 1 |
clean_questions = pd.read_csv("clean_data.csv")
clean_questions.tail()
| Unnamed: 0 | text | choose_one | class_label | |
|---|---|---|---|---|
| 10871 | 10871 | m1 94 01 04 utc ?5km s of volcano hawaii | Relevant | 1 |
| 10872 | 10872 | police investigating after an e bike collided ... | Relevant | 1 |
| 10873 | 10873 | the latest more homes razed by northern calif... | Relevant | 1 |
| 10874 | 10874 | meg issues hazardous weather outlook (hwo) | Relevant | 1 |
| 10875 | 10875 | cityofcalgary has activated its municipal eme... | Relevant | 1 |
数据分布情况
数据是否倾斜
clean_questions.groupby("class_label").count()
| Unnamed: 0 | text | choose_one | |
|---|---|---|---|
| class_label | |||
| 0 | 6187 | 6187 | 6187 |
| 1 | 4673 | 4673 | 4673 |
| 2 | 16 | 16 | 16 |
看起来还算均衡的
处理流程
- 分词
- 训练与测试集
- 检查与验证
from nltk.tokenize import RegexpTokenizer

tokenizer = RegexpTokenizer(r'\w+')

clean_questions["tokens"] = clean_questions["text"].apply(tokenizer.tokenize)
clean_questions.head()
| Unnamed: 0 | text | choose_one | class_label | tokens | |
|---|---|---|---|---|---|
| 0 | 0 | just happened a terrible car crash | Relevant | 1 | [just, happened, a, terrible, car, crash] |
| 1 | 1 | our deeds are the reason of this earthquake m... | Relevant | 1 | [our, deeds, are, the, reason, of, this, earth... |
| 2 | 2 | heard about earthquake is different cities, s... | Relevant | 1 | [heard, about, earthquake, is, different, citi... |
| 3 | 3 | there is a forest fire at spot pond, geese are... | Relevant | 1 | [there, is, a, forest, fire, at, spot, pond, g... |
| 4 | 4 | forest fire near la ronge sask canada | Relevant | 1 | [forest, fire, near, la, ronge, sask, canada] |
语料库情况
from keras.preprocessing.text import Tokenizer
from keras.preprocessing.sequence import pad_sequences
from keras.utils import to_categorical

all_words = [word for tokens in clean_questions["tokens"] for word in tokens]
sentence_lengths = [len(tokens) for tokens in clean_questions["tokens"]]
VOCAB = sorted(list(set(all_words)))
print("%s words total, with a vocabulary size of %s" % (len(all_words), len(VOCAB)))
print("Max sentence length is %s" % max(sentence_lengths))
154724 words total, with a vocabulary size of 18101
Max sentence length is 34
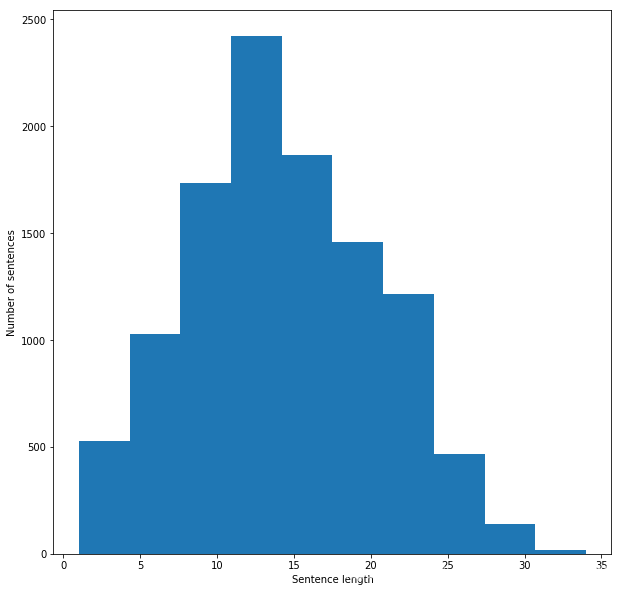
句子长度情况
import matplotlib.pyplot as plt

fig = plt.figure(figsize=(10, 10))
plt.xlabel('Sentence length')
plt.ylabel('Number of sentences')
plt.hist(sentence_lengths)
plt.show()
特征如何构建?
Bag of Words Counts
from sklearn.model_selection import train_test_split
from sklearn.feature_extraction.text import CountVectorizer, TfidfVectorizer

def cv(data):
    count_vectorizer = CountVectorizer()

    emb = count_vectorizer.fit_transform(data)

    return emb, count_vectorizer

list_corpus = clean_questions["text"].tolist()
list_labels = clean_questions["class_label"].tolist()

X_train, X_test, y_train, y_test = train_test_split(list_corpus, list_labels, test_size=0.2,
                                                                                random_state=40)

X_train_counts, count_vectorizer = cv(X_train)
X_test_counts = count_vectorizer.transform(X_test)
PCA展示Bag of Words
from sklearn.decomposition import PCA, TruncatedSVD
import matplotlib
import matplotlib.patches as mpatches


def plot_LSA(test_data, test_labels, savepath="PCA_demo.csv", plot=True):
        lsa = TruncatedSVD(n_components=2)
        lsa.fit(test_data)
        lsa_scores = lsa.transform(test_data)
        color_mapper = {label:idx for idx,label in enumerate(set(test_labels))}
        color_column = [color_mapper[label] for label in test_labels]
        colors = ['orange','blue','blue']
        if plot:
            plt.scatter(lsa_scores[:,0], lsa_scores[:,1], s=8, alpha=.8, c=test_labels, cmap=matplotlib.colors.ListedColormap(colors))
            red_patch = mpatches.Patch(color='orange', label='Irrelevant')
            green_patch = mpatches.Patch(color='blue', label='Disaster')
            plt.legend(handles=[red_patch, green_patch], prop={'size': 30})


fig = plt.figure(figsize=(16, 16))
plot_LSA(X_train_counts, y_train)
plt.show()
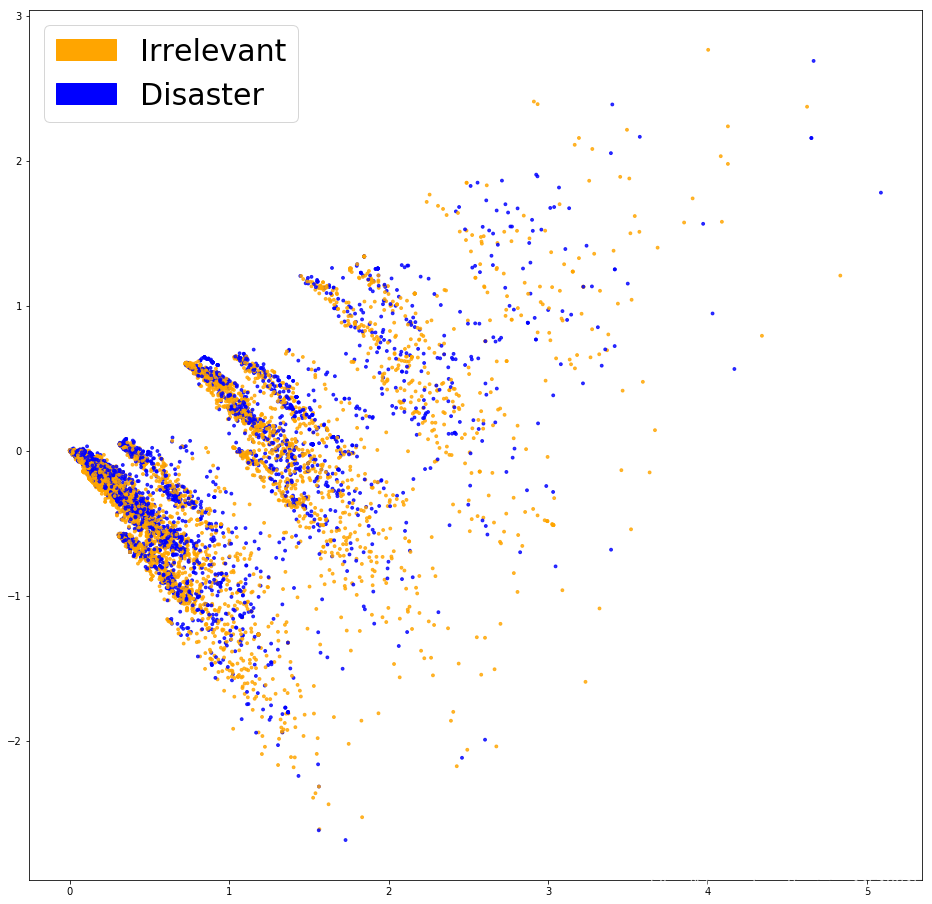
看起来并没有将这两类点区分开
逻辑回归看一下结果
from sklearn.linear_model import LogisticRegression

clf = LogisticRegression(C=30.0, class_weight='balanced', solver='newton-cg',
                         multi_class='multinomial', n_jobs=-1, random_state=40)
clf.fit(X_train_counts, y_train)

y_predicted_counts = clf.predict(X_test_counts)
评估
from sklearn.metrics import accuracy_score, f1_score, precision_score, recall_score, classification_report

def get_metrics(y_test, y_predicted):
    # true positives / (true positives+false positives)
    precision = precision_score(y_test, y_predicted, pos_label=None,
                                    average='weighted')
    # true positives / (true positives + false negatives)
    recall = recall_score(y_test, y_predicted, pos_label=None,
                              average='weighted')

    # harmonic mean of precision and recall
    f1 = f1_score(y_test, y_predicted, pos_label=None, average='weighted')

    # true positives + true negatives/ total
    accuracy = accuracy_score(y_test, y_predicted)
    return accuracy, precision, recall, f1

accuracy, precision, recall, f1 = get_metrics(y_test, y_predicted_counts)
print("accuracy = %.3f, precision = %.3f, recall = %.3f, f1 = %.3f" % (accuracy, precision, recall, f1))
accuracy = 0.754, precision = 0.752, recall = 0.754, f1 = 0.753
混淆矩阵检查
import numpy as np
import itertools
from sklearn.metrics import confusion_matrix

def plot_confusion_matrix(cm, classes,
                          normalize=False,
                          title='Confusion matrix',
                          cmap=plt.cm.winter):
    if normalize:
        cm = cm.astype('float') / cm.sum(axis=1)[:, np.newaxis]
    plt.imshow(cm, interpolation='nearest', cmap=cmap)
    plt.title(title, fontsize=30)
    plt.colorbar()
    tick_marks = np.arange(len(classes))
    plt.xticks(tick_marks, classes, fontsize=20)
    plt.yticks(tick_marks, classes, fontsize=20)

    fmt = '.2f' if normalize else 'd'
    thresh = cm.max() / 2.

    for i, j in itertools.product(range(cm.shape[0]), range(cm.shape[1])):
        plt.text(j, i, format(cm[i, j], fmt), horizontalalignment="center",
                 color="white" if cm[i, j] < thresh else "black", fontsize=40)

    plt.tight_layout()
    plt.ylabel('True label', fontsize=30)
    plt.xlabel('Predicted label', fontsize=30)

    return plt
cm = confusion_matrix(y_test, y_predicted_counts)
fig = plt.figure(figsize=(10, 10))
plot = plot_confusion_matrix(cm, classes=['Irrelevant','Disaster','Unsure'], normalize=False, title='Confusion matrix')
plt.show()
print(cm)
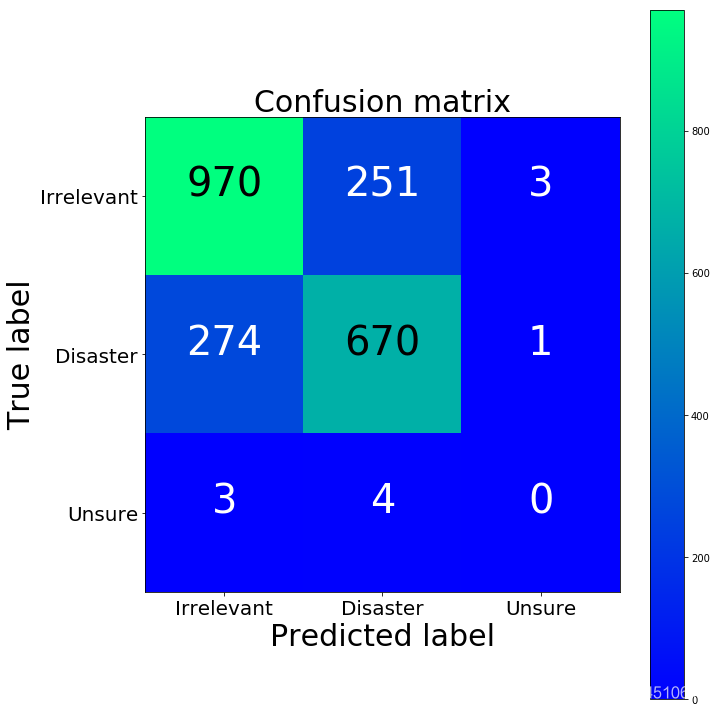
[[970 251   3]
 [274 670   1]
 [  3   4   0]]
第三类咋没有一个呢。。。因为数据里面就没几个啊。。。
进一步检查模型的关注点
def get_most_important_features(vectorizer, model, n=5):
    index_to_word = {v:k for k,v in vectorizer.vocabulary_.items()}

    # loop for each class
    classes ={}
    for class_index in range(model.coef_.shape[0]):
        word_importances = [(el, index_to_word[i]) for i,el in enumerate(model.coef_[class_index])]
        sorted_coeff = sorted(word_importances, key = lambda x : x[0], reverse=True)
        tops = sorted(sorted_coeff[:n], key = lambda x : x[0])
        bottom = sorted_coeff[-n:]
        classes[class_index] = {
            'tops':tops,
            'bottom':bottom
        }
    return classes

importance = get_most_important_features(count_vectorizer, clf, 10)
def plot_important_words(top_scores, top_words, bottom_scores, bottom_words, name):
    y_pos = np.arange(len(top_words))
    top_pairs = [(a,b) for a,b in zip(top_words, top_scores)]
    top_pairs = sorted(top_pairs, key=lambda x: x[1])

    bottom_pairs = [(a,b) for a,b in zip(bottom_words, bottom_scores)]
    bottom_pairs = sorted(bottom_pairs, key=lambda x: x[1], reverse=True)

    top_words = [a[0] for a in top_pairs]
    top_scores = [a[1] for a in top_pairs]

    bottom_words = [a[0] for a in bottom_pairs]
    bottom_scores = [a[1] for a in bottom_pairs]

    fig = plt.figure(figsize=(10, 10))

    plt.subplot(121)
    plt.barh(y_pos,bottom_scores, align='center', alpha=0.5)
    plt.title('Irrelevant', fontsize=20)
    plt.yticks(y_pos, bottom_words, fontsize=14)
    plt.suptitle('Key words', fontsize=16)
    plt.xlabel('Importance', fontsize=20)

    plt.subplot(122)
    plt.barh(y_pos,top_scores, align='center', alpha=0.5)
    plt.title('Disaster', fontsize=20)
    plt.yticks(y_pos, top_words, fontsize=14)
    plt.suptitle(name, fontsize=16)
    plt.xlabel('Importance', fontsize=20)

    plt.subplots_adjust(wspace=0.8)
    plt.show()

top_scores = [a[0] for a in importance[1]['tops']]
top_words = [a[1] for a in importance[1]['tops']]
bottom_scores = [a[0] for a in importance[1]['bottom']]
bottom_words = [a[1] for a in importance[1]['bottom']]

plot_important_words(top_scores, top_words, bottom_scores, bottom_words, "Most important words for relevance")
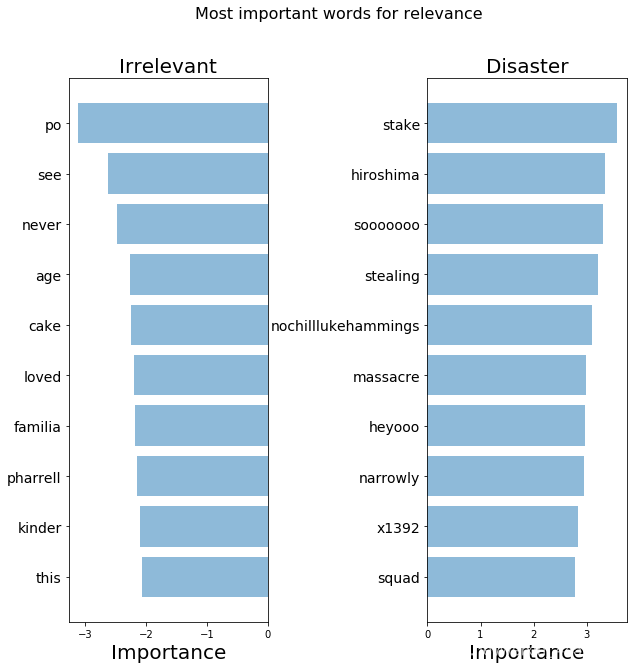
我们的模型找到了一些模式,但是看起来还不够好
TFIDF Bag of Words
这样我们就不均等对待每一个词了
def tfidf(data):
    tfidf_vectorizer = TfidfVectorizer()

    train = tfidf_vectorizer.fit_transform(data)

    return train, tfidf_vectorizer

X_train_tfidf, tfidf_vectorizer = tfidf(X_train)
X_test_tfidf = tfidf_vectorizer.transform(X_test)
F:\anaconda\lib\site-packages\sklearn\feature_extraction\text.py:1089: FutureWarning: Conversion of the second argument of issubdtype from `float` to `np.floating` is deprecated. In future, it will be treated as `np.float64 == np.dtype(float).type`.
  if hasattr(X, 'dtype') and np.issubdtype(X.dtype, np.float):
fig = plt.figure(figsize=(16, 16))
plot_LSA(X_train_tfidf, y_train)
plt.show()

看起来好那么一丁丁丁丁点
clf_tfidf = LogisticRegression(C=30.0, class_weight='balanced', solver='newton-cg',
                         multi_class='multinomial', n_jobs=-1, random_state=40)
clf_tfidf.fit(X_train_tfidf, y_train)

y_predicted_tfidf = clf_tfidf.predict(X_test_tfidf)
accuracy_tfidf, precision_tfidf, recall_tfidf, f1_tfidf = get_metrics(y_test, y_predicted_tfidf)
print("accuracy = %.3f, precision = %.3f, recall = %.3f, f1 = %.3f" % (accuracy_tfidf, precision_tfidf,
                                                                       recall_tfidf, f1_tfidf))
accuracy = 0.762, precision = 0.760, recall = 0.762, f1 = 0.761
cm2 = confusion_matrix(y_test, y_predicted_tfidf)
fig = plt.figure(figsize=(10, 10))
plot = plot_confusion_matrix(cm2, classes=['Irrelevant','Disaster','Unsure'], normalize=False, title='Confusion matrix')
plt.show()
print("TFIDF confusion matrix")
print(cm2)
print("BoW confusion matrix")
print(cm)
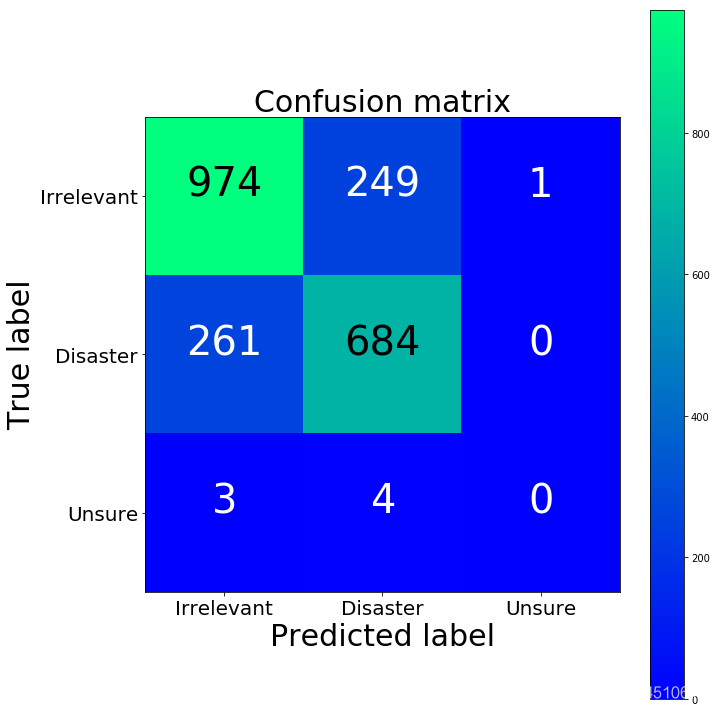
TFIDF confusion matrix
[[974 249   1]
 [261 684   0]
 [  3   4   0]]
BoW confusion matrix
[[970 251   3]
 [274 670   1]
 [  3   4   0]]
词语的解释
importance_tfidf = get_most_important_features(tfidf_vectorizer, clf_tfidf, 10)
top_scores = [a[0] for a in importance_tfidf[1]['tops']]
top_words = [a[1] for a in importance_tfidf[1]['tops']]
bottom_scores = [a[0] for a in importance_tfidf[1]['bottom']]
bottom_words = [a[1] for a in importance_tfidf[1]['bottom']]

plot_important_words(top_scores, top_words, bottom_scores, bottom_words, "Most important words for relevance")
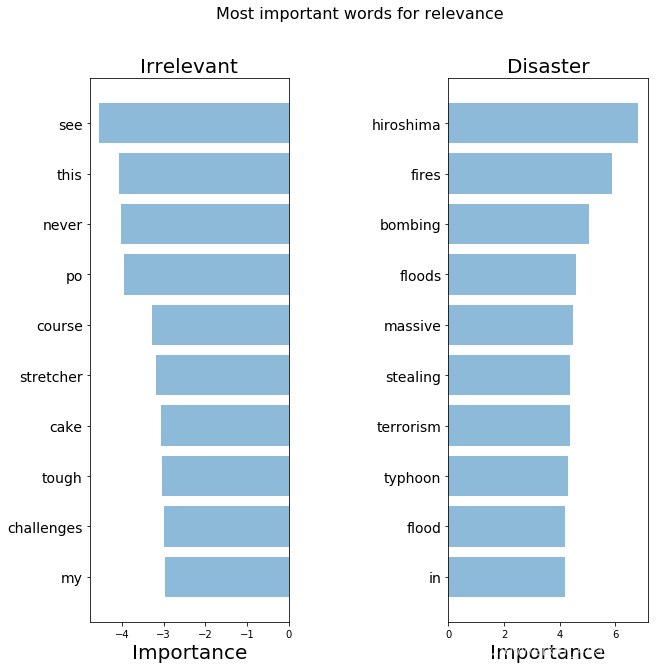
这些词看起来比之前强一些了


 1万+
1万+


 被折叠的 条评论
为什么被折叠?
被折叠的 条评论
为什么被折叠?
 到【灌水乐园】发言


