 使用Pandas与Matplotlib进行数据分析


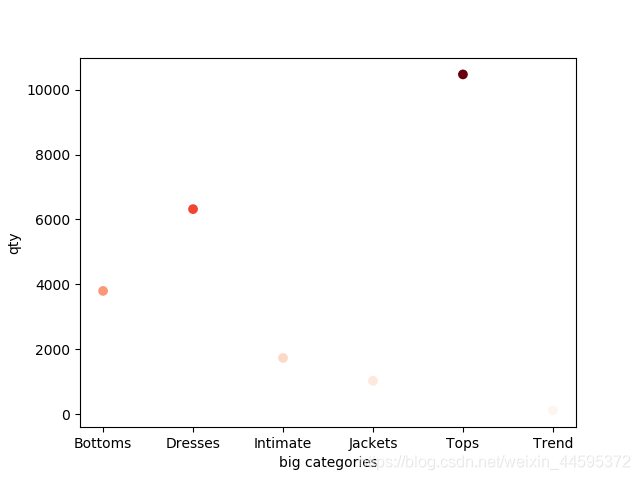
 本篇博客介绍了一种使用Python中的Pandas库进行数据处理和Matplotlib库进行数据可视化的流程。通过示例代码展示了如何读取CSV文件中的数据,利用Pandas进行分组计数并排序,最后使用Matplotlib绘制出反映各主要类别数量的散点图。
import pandas as pd
import  matplotlib.pyplot as plt

#设置显示的行列数
pd.set_option('display.max_rows',25000)
pd.set_option('display.max_columns',30)

#读取数据
data=pd.read_csv('wc0329.csv')

#利用groupby聚合,并排序
sku=data.groupby(['bigcato']).count().sort_values('sku')
x=sku.index
y=sku['sku']

#matplotlib包绘制散点图,颜色与y值做了映射,值越大,颜色越深

plt.scatter(x,y,c=y,cmap='Reds')
plt.xlabel('big categories')
plt.ylabel('qty')
plt.show()
#输出:


 1346
1346

 被折叠的 条评论
为什么被折叠?
被折叠的 条评论
为什么被折叠?
 到【灌水乐园】发言


