


使用 “xlsx-js-style” 将数组数据导出成Excel表格
一、环境需求:
xlsx-js-style :-------------》1.2.0版本
file-saver :-------------》1.3.8版本
二、相关代码
import XLSXS from 'xlsx-js-style';
import { saveAs } from 'file-saver';

function exportExcel(data) {
    // 后端返回data是一个长度为1的json数组
    for(let i in data[0]) {
        temp.push({
          v: data[0][i],
          t: "s",
          s: {
            font: {
              bold: false,
              sz: 16,
              name: '宋体',
            },
            alignment: {
              vertical: 'center', // 垂直居中
              horizontal: 'center', // 水平居中
            },
            // border 边框属性
            border: {
              top: { style: 'thin' },
              bottom: { style: 'thin' },
              left: { style: 'thin' },
              right: { style: 'thin' }
            },
          }
        })
        keys.push(i.replace(/\s+/g,'')) // 因原数据中携带空字符
    }
    const header = [
        // 第一行,需要样式,则数组中元素为对象,进行定义样式。
        [
          {
            v: this.valueAnalyCls,
            t: 's',
            s: {
              // font 字体属性
              font: {
                bold: true,
                sz: 20,
                name: '宋体',
              },
              // alignment 对齐方式
              alignment: {
                vertical: 'center', // 垂直居中
                horizontal: 'center', // 水平居中
              },
              // border 边框属性
              border: {
                top: { style: 'thin' },
                bottom: { style: 'thin' },
                left: { style: 'thin' },
                right: { style: 'thin' }
              },
              // fill 颜色填充属性
              fill: {
                fgColor: { rgb: 'D2D5DB' },
              },
            },
          },
        ],
        cellKeys,
      ]
      body.unshift(...header);
      const sheet = XLSXS.utils.aoa_to_sheet(body);
      const cols = [];
      // 每一列宽度
      keys.forEach(element => {
        cols.push({ wpx: 200 })
      });
      sheet['!cols'] = cols; // 添加到sheet中
      const rows = [
        { hpx: 32 },
        { hpx: 20 },
      ]
      sheet['!rows'] = rows; // 添加到sheet中
      const merge = [{ // 需要合并的单元格的位置信息
        s: { r: 0, c: 0 },
        e: { r: 0, c: keys.length - 1 }
      }];
      const workbook = XLSXS.utils.book_new();
      sheet['!merges'] = merge; // 设置合并单元格的位置信息
      XLSXS.utils.book_append_sheet(workbook, sheet, "汇总情况");
      XLSXS.writeFile(workbook, Date.now() + "汇总情况.xlsx"); // 导出 workbook
},
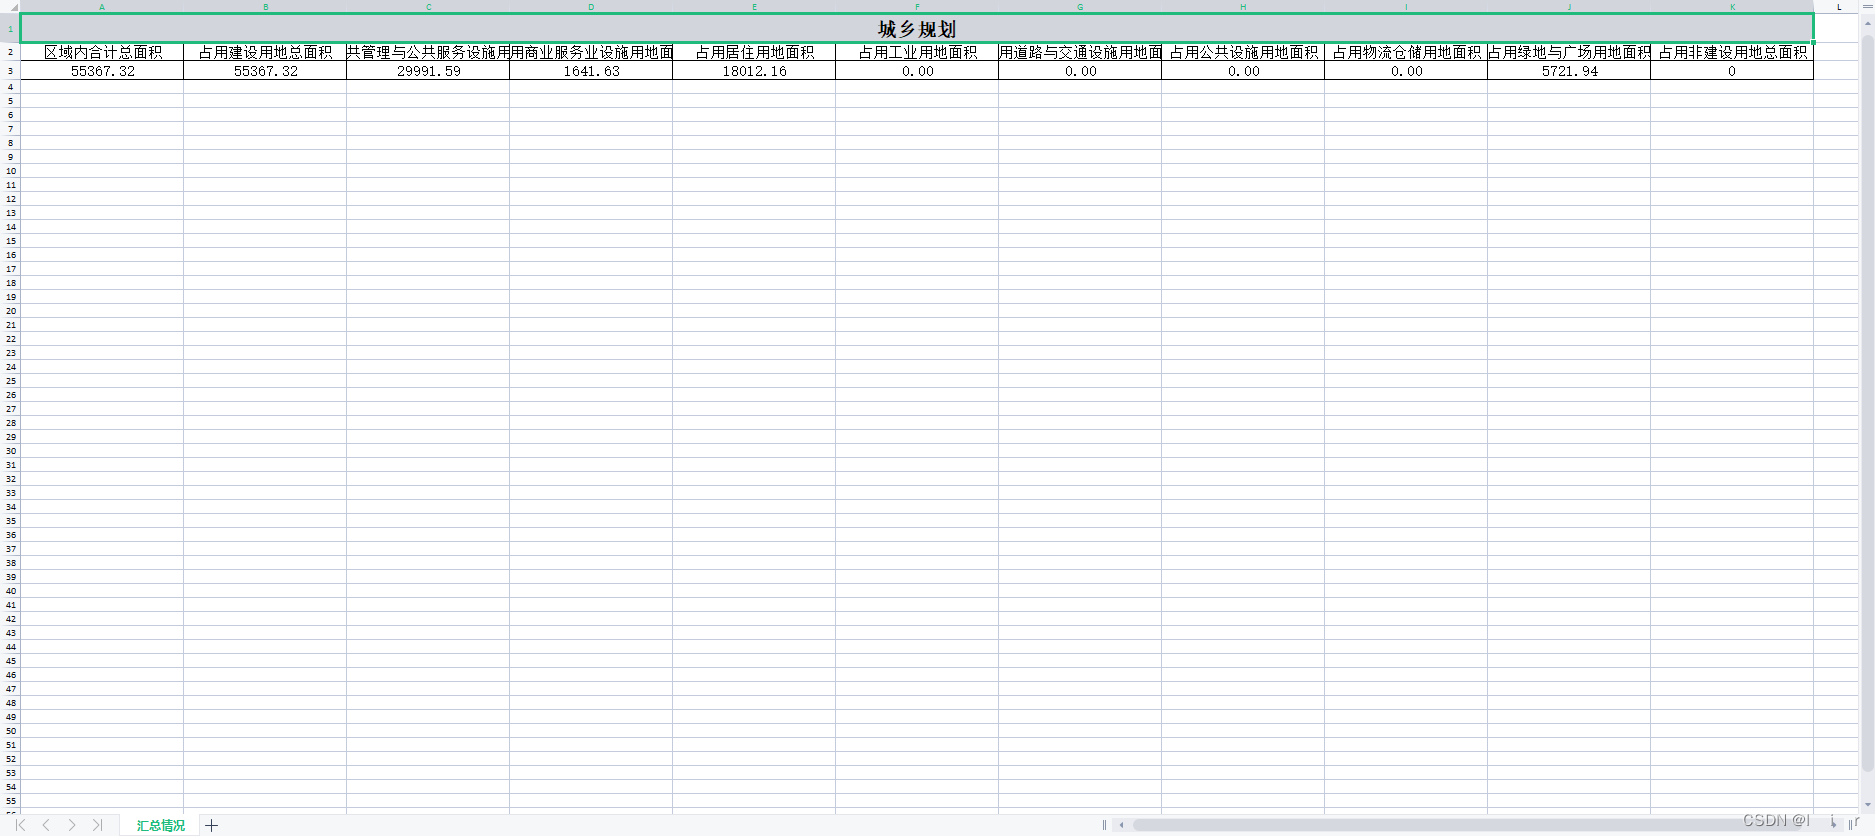
三、最终效果
四、相关参数
上述代码中,相关参数可根据实际需求更改。根据游览源码所知
列cols参数有
interface ColInfo {
	/* --- visibility --- */

	/** if true, the column is hidden */
	hidden?: boolean;

	/* --- column width --- */

	/** width in Excel's "Max Digit Width", width*256 is integral */
	width?: number;

	/** width in screen pixels */
	wpx?: number;

	/** width in "characters" */
	wch?: number;

	/** outline / group level */
	level?: number;

	/** Excel's "Max Digit Width" unit, always integral */
	MDW?: number;

	/** DBF Field Header */
	DBF?: DBFField;
}
行rows参数有
interface RowInfo {
	/* --- visibility --- */

	/** if true, the column is hidden */
	hidden?: boolean;

	/* --- row height --- */

	/** height in screen pixels */
	hpx?: number;

	/** height in points */
	hpt?: number;

	/** outline / group level */
	level?: number;
}
合并merge参数有
interface Range {
	/** Starting cell */
	s: CellAddress;
	/** Ending cell */
	e: CellAddress;
}

interface CellAddress {
	/** Column number */
	c: number;
	/** Row number */
	r: number;
}
单元格样式 (即上述代码中的s) 参数有
interface CellStyle {
	alignment?: {
		/**
		 * Horizontal alignment
		 * @default 'left'
		 */
		horizontal?: "left" | "center" | "right";
		/**
		 * Vertical alignment
		 * @default 'bottom'
		 */
		vertical?: "top" | "center" | "bottom";
		/**
		 * Rotate text
		 * - range `0` to `180`
		 * - or `255` // `255` is a special value that aligns vertically
		 * @example 180 // rotated down 180 degrees
		 */
		textRotation?: number;
		/**
		 * Wrap text
		 * @default false
		 */
		wrapText?: boolean;
	};
	border?: {
		top?: { color: CellStyleColor; style?: BorderType };
		bottom?: { color: CellStyleColor; style?: BorderType };
		left?: { color: CellStyleColor; style?: BorderType };
		right?: { color: CellStyleColor; style?: BorderType };
		diagonal?: { color: CellStyleColor; style?: BorderType; diagonalUp?: boolean; diagonalDown?: boolean };
	};
	fill?: {
		/**
		 * background color
		 */
		bgColor?: CellStyleColor;
		/**
		 * foreground color
		 */
		fgColor?: CellStyleColor;
		/**
		 * Fill pattern
		 * - `"none"` prevents fill regardless of color selection
		 * @default 'solid'
		 */
		patternType?: "solid" | "none";
	};
	font?: {
		/**
		 * bold font?
		 * @default false
		 */
		bold?: boolean;
		/**
		 * font color
		 * @example {rgb: 'FF0000'} // red color
		 */
		color?: CellStyleColor;
		/**
		 * italic font?
		 * @default false
		 */
		italic?: boolean;
		/**
		 * font face
		 * @default 'Calibri'
		 */
		name?: string;
		/**
		 * font size (points)
		 * @default 11
		 */
		sz?: number;
		/**
		 * font > effect > strikethrough
		 * @default false
		 */
		strike?: boolean;
		/**
		 * underline font?
		 * @default false
		 */
		underline?: boolean;
		/**
		 * font > effect > subscript/subscript
		 * - values: "subscript" | "superscript"
		 * @default null
		 */
		vertAlign?: "superscript" | "subscript";
	};
	/**
	 * Number format
	 * @example "0" // integer index to built in formats, see StyleBuilder.SSF property                     |
	 * @example "0.00%" // string matching a built-in format, see StyleBuilder.SSF                          |
	 * @example "0.0%" // string specifying a custom format                                                 |
	 * @example "0.00%;\\(0.00%\\);\\-;@" // string specifying a custom format, escaping special characters |
	 * @example "m/dd/yy" // string a date format using Excel's format notation                             |
	 * @default '0'
	 */
	numFmt?: string;
}


 1万+
1万+


 被折叠的 条评论
为什么被折叠?
被折叠的 条评论
为什么被折叠?
 到【灌水乐园】发言


