


使用zabbix监控php-fpm服务
1.开启php-fpm状态监控
1.开启php-fpm状态监控
[root@192_168_81_220 ~]# vim /etc/php-fpm.d/www.conf
pm.status_path = /php_status

2.配置nginx连接php-fpm
[root@192_168_81_220 ~]# vim /etc/nginx/nginx.conf
        location /php_status {
                fastcgi_pass 127.0.0.1:9000;
                fastcgi_index index.php;
                fastcgi_param SCRIPT_FILENAME $document_root$fastcgi_script_name;
                include fastcgi_params;
        }

3.重启服务
[root@192_168_81_220 ~]# systemctl restart nginx
[root@192_168_81_220 ~]# systemctl restart php-fpm
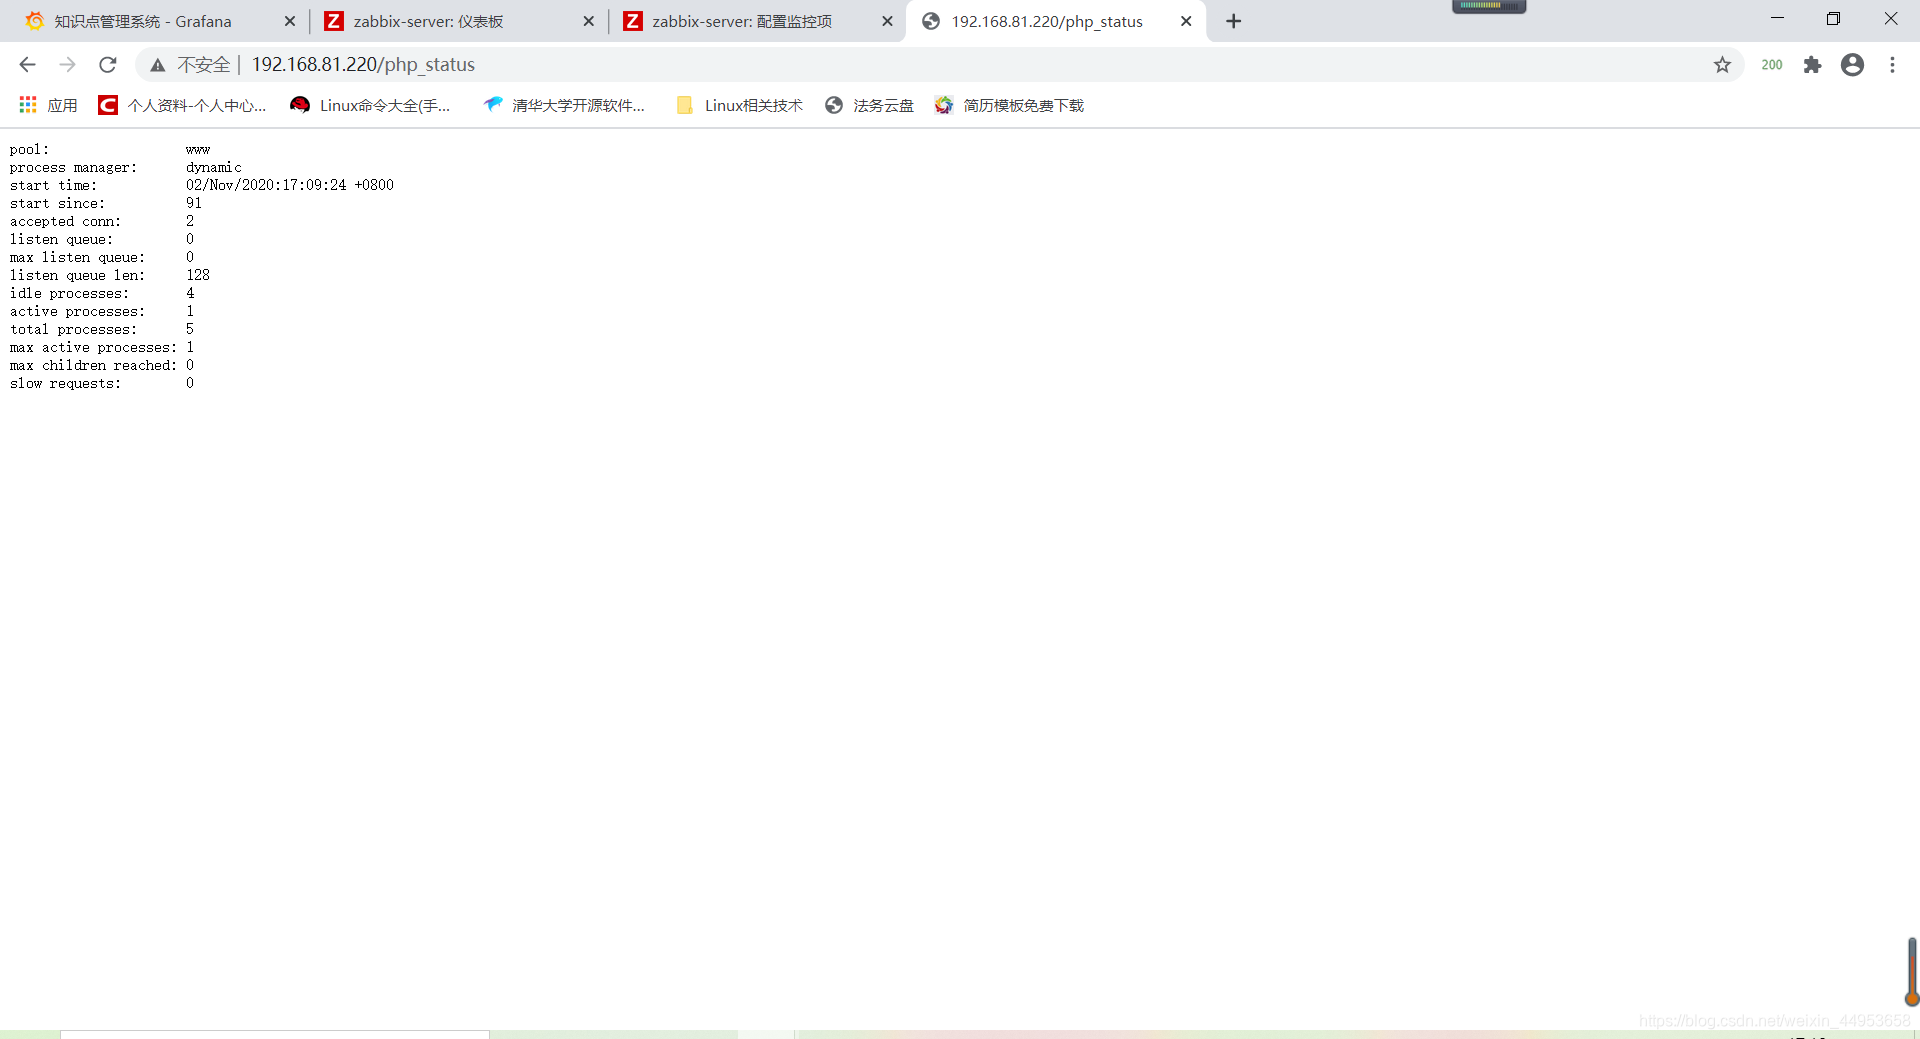
2.测试监控页面并访问
[root@192_168_81_220 ~]# curl 127.0.0.1/php_status
pool:                 www
process manager:      dynamic
start time:           02/Nov/2020:17:09:24 +0800
start since:          39
accepted conn:        1
listen queue:         0
max listen queue:     0
listen queue len:     128
idle processes:       4
active processes:     1
total processes:      5
max active processes: 1
max children reached: 0
slow requests:        0
accepts 4 //nginx启动到现在共接收了多少个请求
handled 4 //nginx启动到现在共处理了多少个请求
requests //总的http请求数
Reading: 0 //当前读取的连接请求头数
Writing: 1 //当前响应客户端请求数
Waiting: 0 //当前的等待请求数
writing+waiting的值要等于Active connections的值
3.利用zabbix监控php-fpm状态值
思路:
1.首先编写获取值的脚本,由于是web页面,因此可以通过curl命令来抓取
2.脚本里面可以定义函数,每一个值对应一个函数,最后在使用case判断传参进来的$1与那个函数匹配,匹配正确则执行函数,再定义一个$2展示访问url
3.定义传参形式的监控项key,这样就可以定义一个key值,写不同的$1就可以了
3.1.编写获取监控值脚本
脚本编写思路:首先将curl命令获取的数据保存到一个文件中,然后定义当前时间和文件时间的变量,进行比较,如果当前时间比文件时间大于60s,则把curl命令的文件进行删除,重新curl获取数据并导入到文件中,最后通过定义各种状态的函数,函数里面主要就是通过文件把状态值获取到,再通过case进行判断要传那个参数,最后执行对应参数的命令获取监控值
最后监测进程是否存活可以通过ps查到进程然后通过wc -l获取数量,最后echo这个值,然后创建触发器,最新值等于0就表示进程不存在
#!/bin/bash
#这是一个简单的监控php-fpm状态值的脚本
#20201103 	---jxl
comm_para=$1
PHP_URL=$2
cachefile=/tmp/php_status.txt
port=80
file_time=`stat -c %Y $cachefile`
now_time=`date +%s`
rm_file=$(($now_time-$file_time))
if [ -z $2 ];then
	url=http://127.0.0.1:$port/php_status
else
	url=$PHP_URL
fi
cmd="/usr/bin/curl $url"

if [ ! -e $cachefile ];then
	$cmd > $cachefile 2>/dev/null
fi

if [ $rm_file -gt 60 ];then
	rm -rf $cachefile
fi

if [ ! -f $cachefile ];then
	$cmd > $cachefile 2>/dev/null
fi

start_since() {
	#运行时长
	cat $cachefile | awk '/since/{print $3}'
	exit 0;
}

accepted_conn() {
	cat $cachefile | awk '/accepted/{print $3}'
	exit 0;
}

listen_queue(){
        cat $cachefile | awk '{if(NR==6){print $3}}'
	exit 0;
}

max_listen_queue(){
	cat $cachefile | awk '{if(NR==7){print $4}}'
	exit 0;
}

listen_queue_len() {
	cat $cachefile | awk '{if(NR==8){print $4}}'
	exit 0;
}

idle_processes() {
	cat $cachefile | awk '/idle/{print $3}'
	exit 0;
}

active_processes() {
	cat $cachefile | awk '{if(NR==10){print $3}}'
	exit 0;
}

total_processes() {
	cat $cachefile | awk '{if(NR==11){print $3}}'
        exit 0;
}

max_active_processes() {
	cat $cachefile | awk '{if(NR==12){print $4}}'
        exit 0;
}

max_children_reached() {
	cat $cachefile | awk '{if(NR==13){print $4}}'
        exit 0;
}

slow_requests() {
	cat $cachefile | awk '{if(NR==14){print $3}}'
        exit 0;
}

check() {
        php_pro_count=`ps aux | grep php | grep -v grep | grep -v php-fpm_status.sh | wc -l`
        echo $php_pro_count
}

case "$comm_para" in
start_since)
	start_since
	;;
accepted_conn)
	accepted_conn
	;;
listen_queue)
	listen_queue
	;;
max_listen_queue)
	max_listen_queue
	;;
listen_queue_len)
	listen_queue_len
	;;
idle_processes)
	idle_processes
	;;
active_processes)
	active_processes
	;;
total_processes)
	total_processes
	;;
max_active_processes)
	max_active_processes
	;;
max_children_reached)
	max_children_reached
	;;
slow_requests)
	slow_requests
	;;
check)
	check
	;;
*)
	echo "invalid status"
	exit 2;
esac
3.2.编写自定义监控项配置文件
[root@192_168_81_220 ~]# cat /etc/zabbix/zabbix_agentd.d/php-fpm.conf
UserParameter=php_status[*],/bin/bash /etc/zabbix/scripts/php-fpm_status.sh $1 $2

[root@192_168_81_220 ~]# systemctl restart zabbix-agent


zabbix-server测试
[root@zabbix-server ~]# zabbix_get -s 192.168.81.220 -k php_status[max_active_processes,http://192.168.81.220/php_status]
1
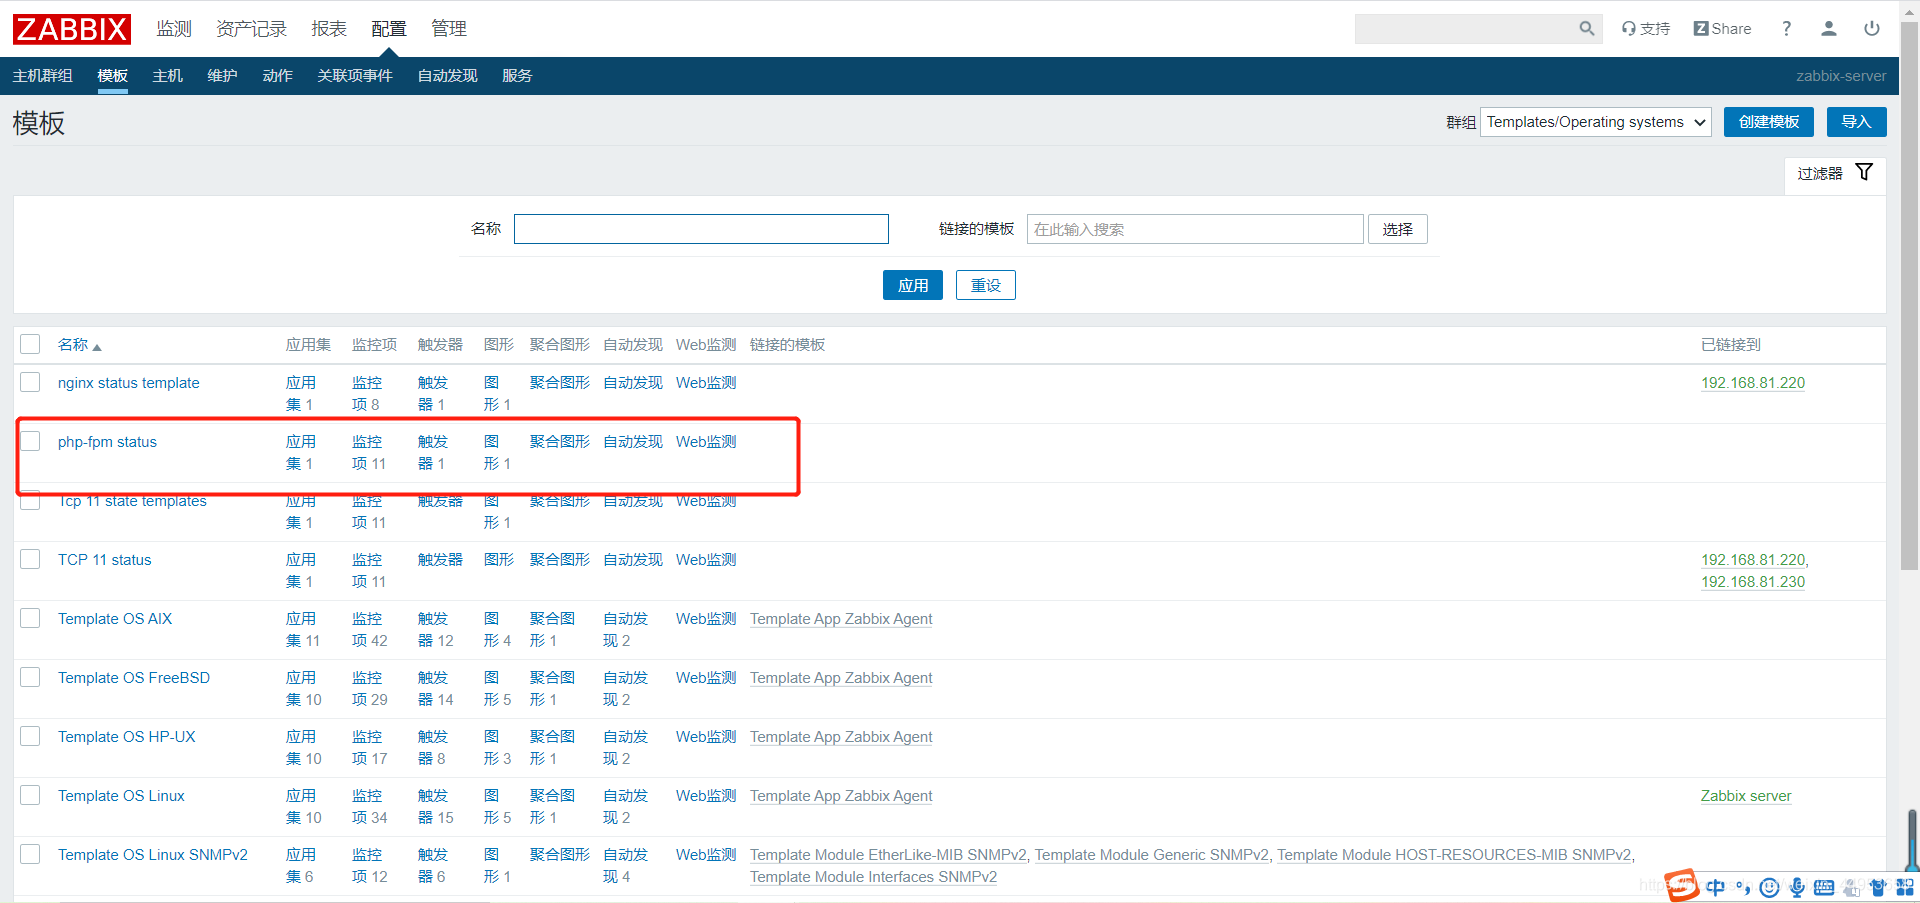
3.3.创建监控模板
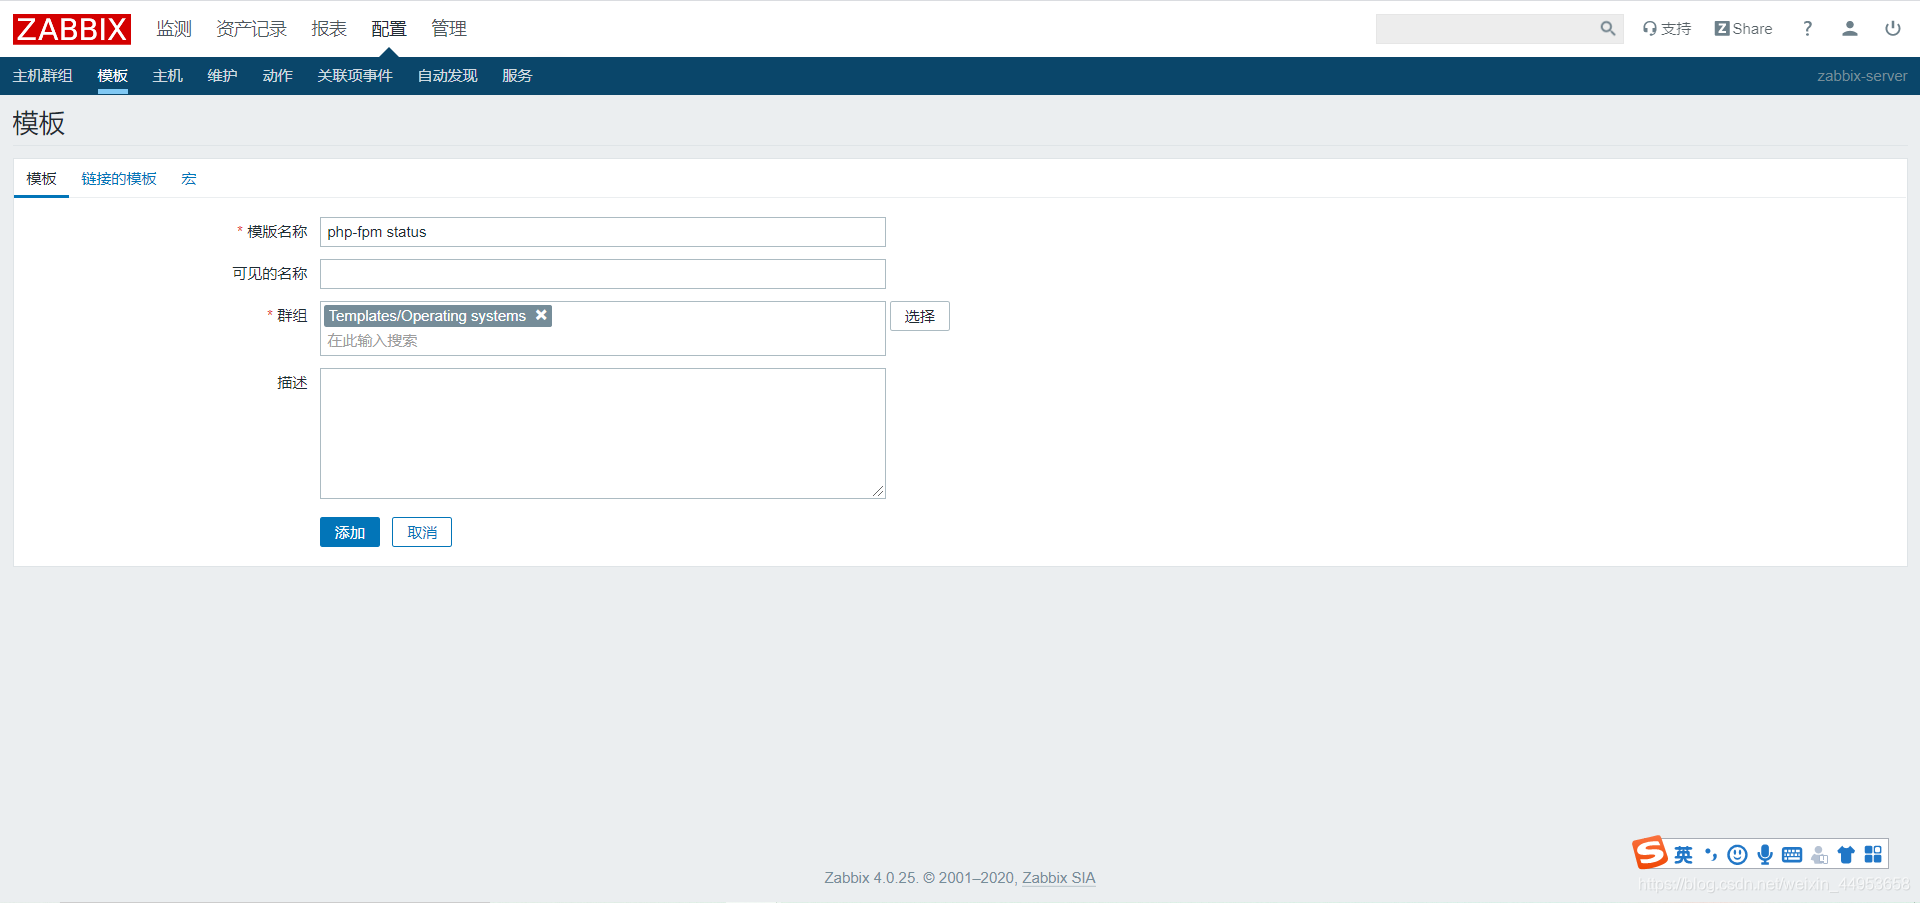
3.3.1.点击创建模板
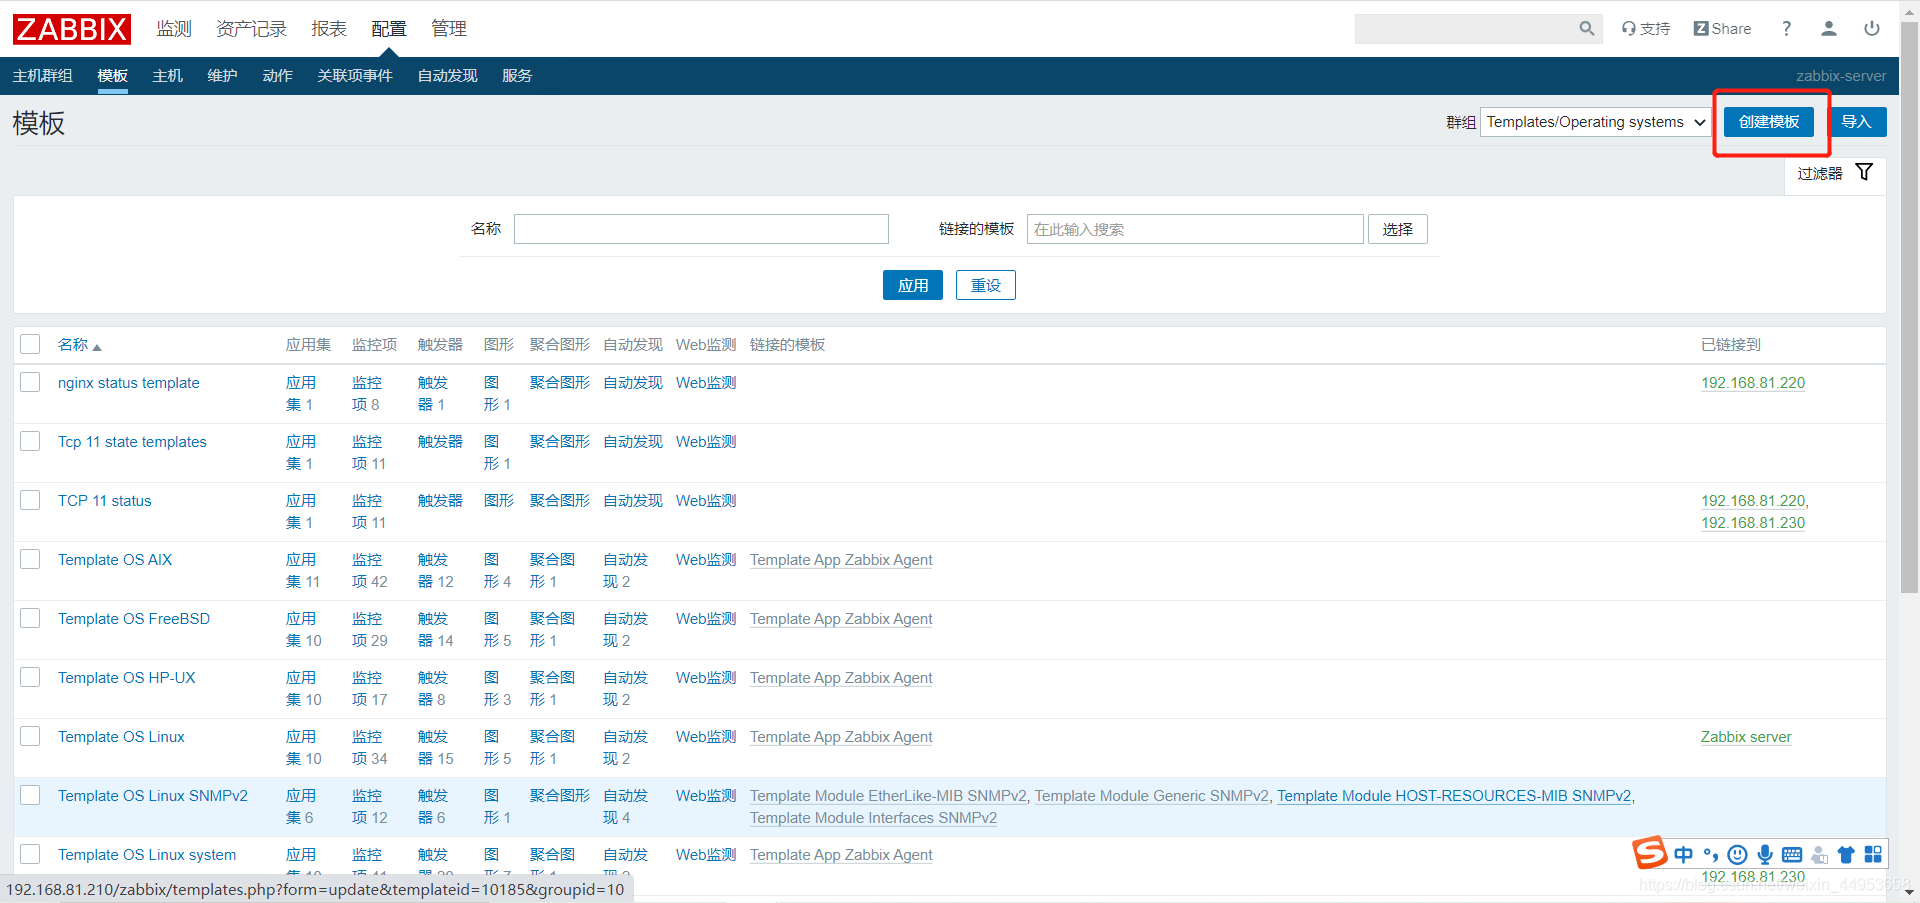
设置名称:php-fpm status
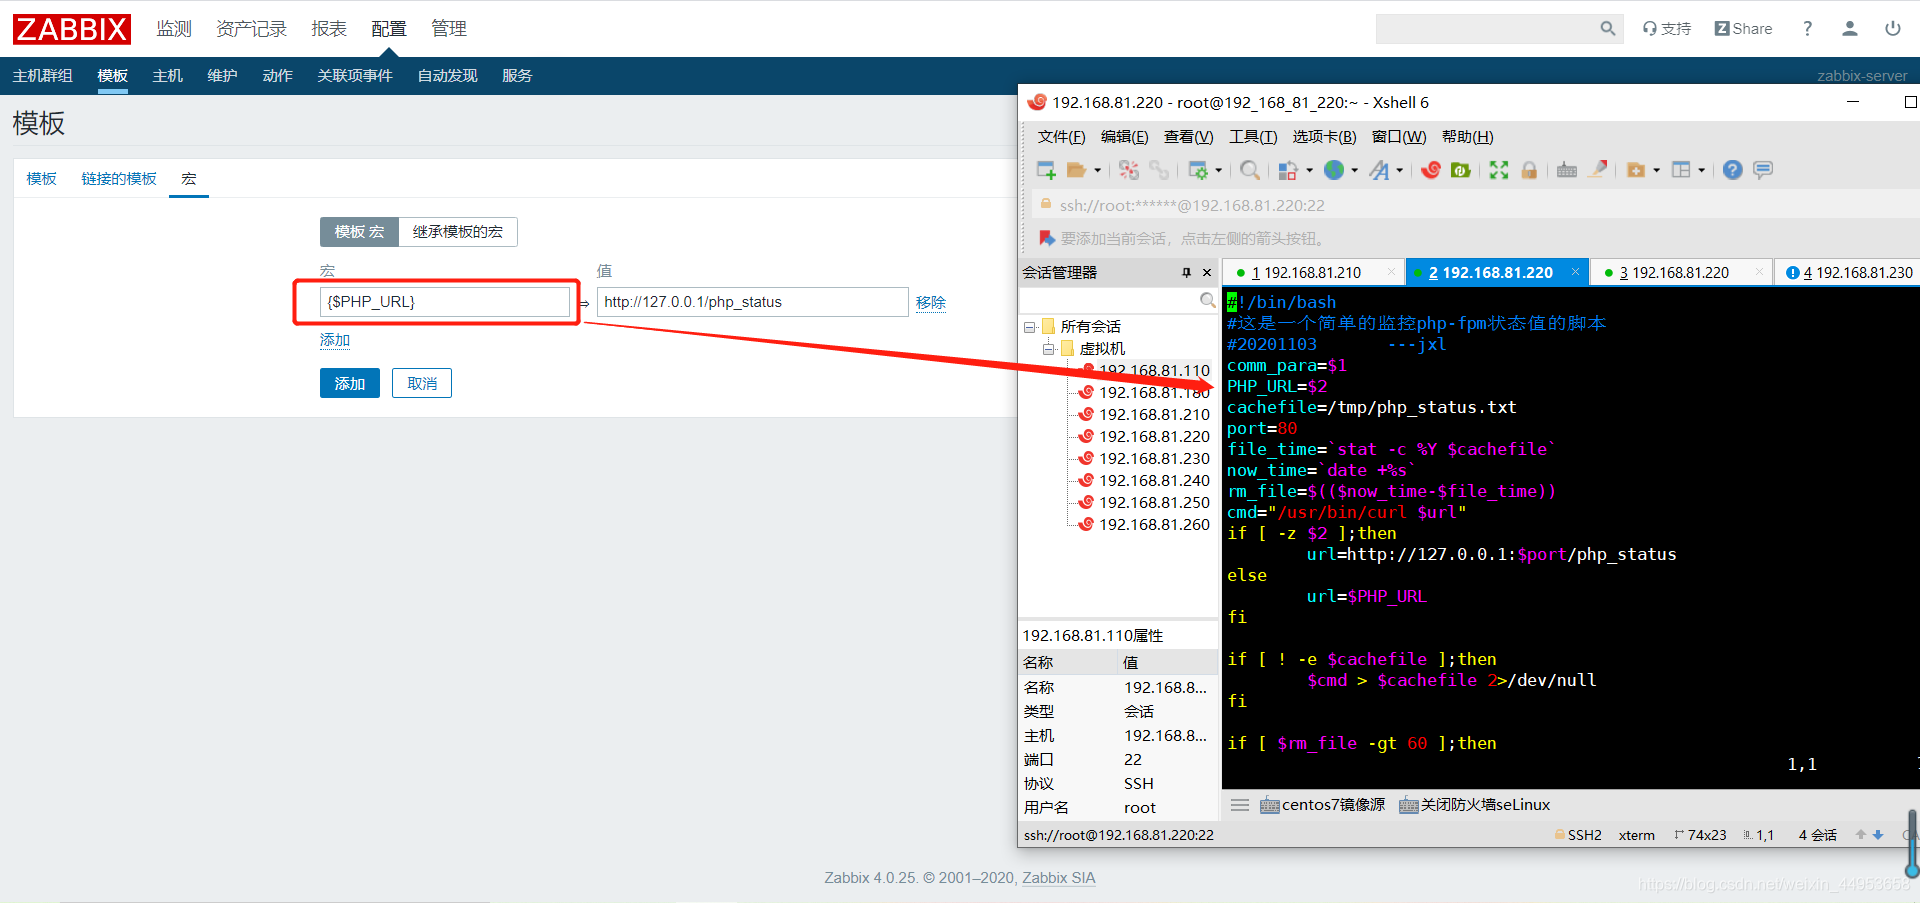
3.3.2.设置宏
这个宏其实就是zabbix设置变量的地方,宏要对应脚本中的php_url
宏:{$PHP_URL} 值:http://127.0.0.1/php_status
3.3.3.创建应用集
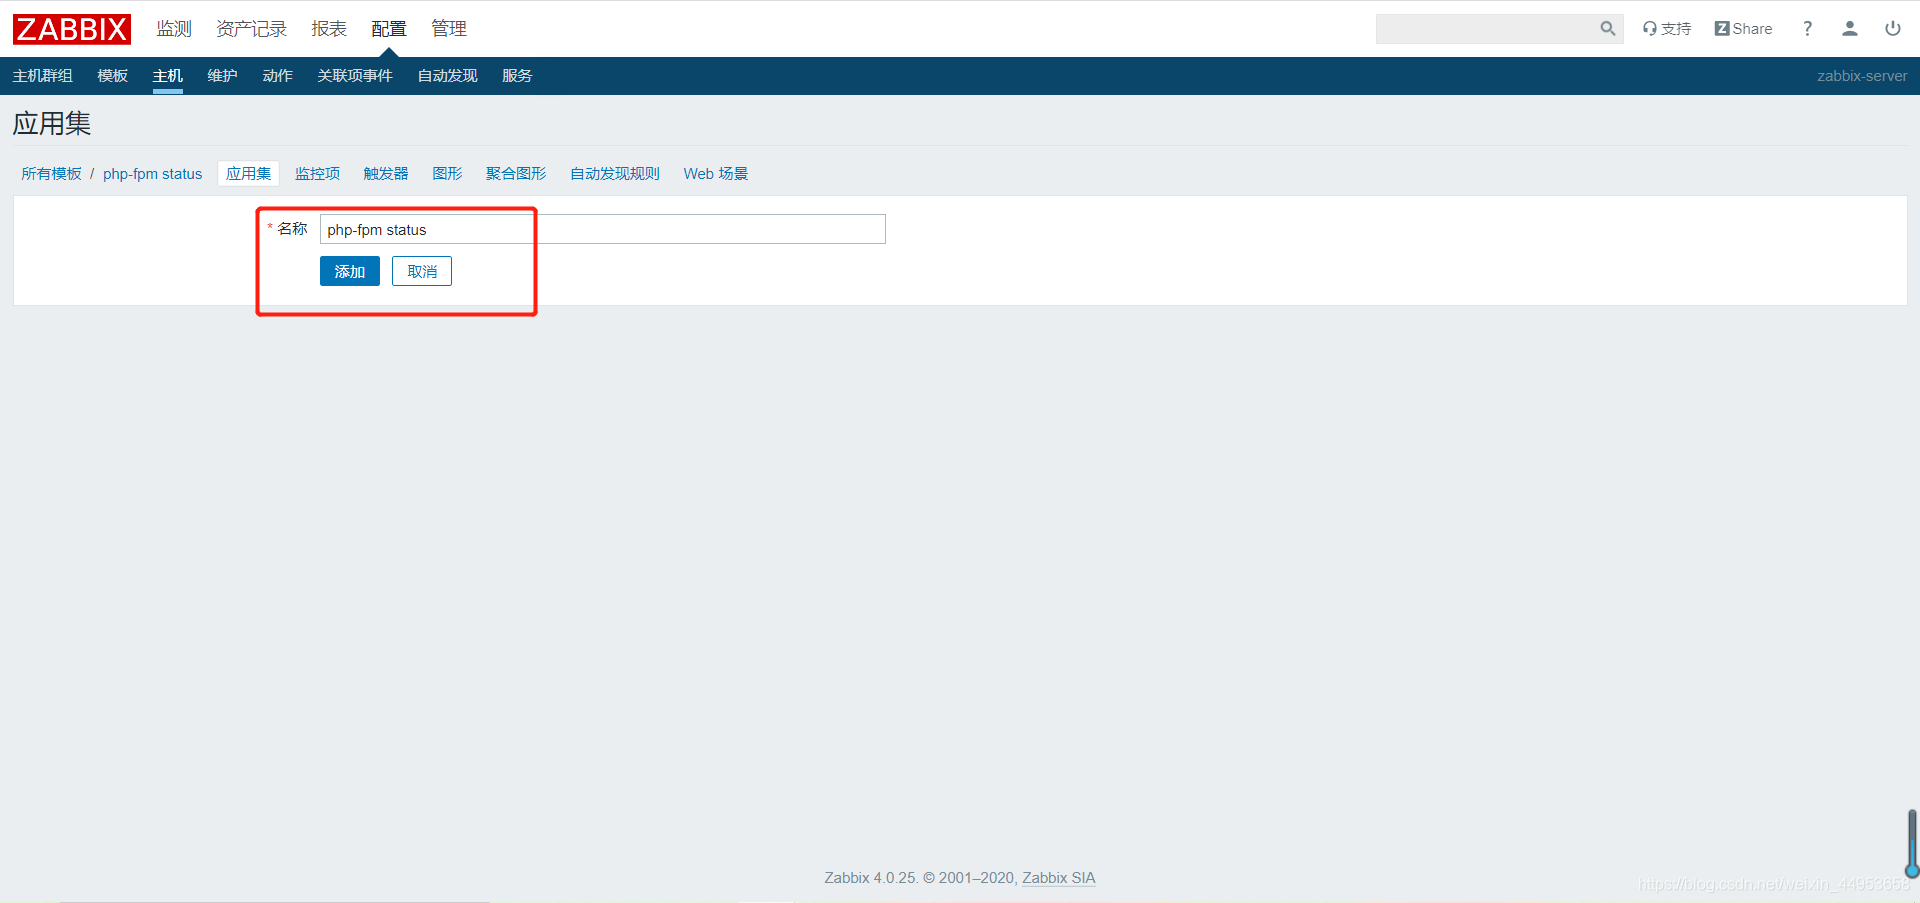
3.3.4.创建监控项
名称:start_since运行时长
键值:php_status[start_since,{$PHP_URL}]
更新间隔:60s,因为脚本里面的判断时间就是60s
应用集选择:php-fpm status

其他监控项配置一致,只是参数key值不一样
所有监控项key值
php_status[start_since,{$PHP_URL}]
php_status[accepted_conn,{$PHP_URL}]
php_status[listen_queue,{$PHP_URL}]
php_status[max_listen_queue,{$PHP_URL}]
php_status[listen_queue_len,{$PHP_URL}]
php_status[idle_processes,{$PHP_URL}]
php_status[active_processes,{$PHP_URL}]
php_status[total_processes,{$PHP_URL}]
php_status[active_processes,{$PHP_URL}]
php_status[max_active_processes,{$PHP_URL}]
php_status[max_children_reached,{$PHP_URL}]
php_status[slow_requests,{$PHP_URL}]
php_status[check,{$PHP_URL}]
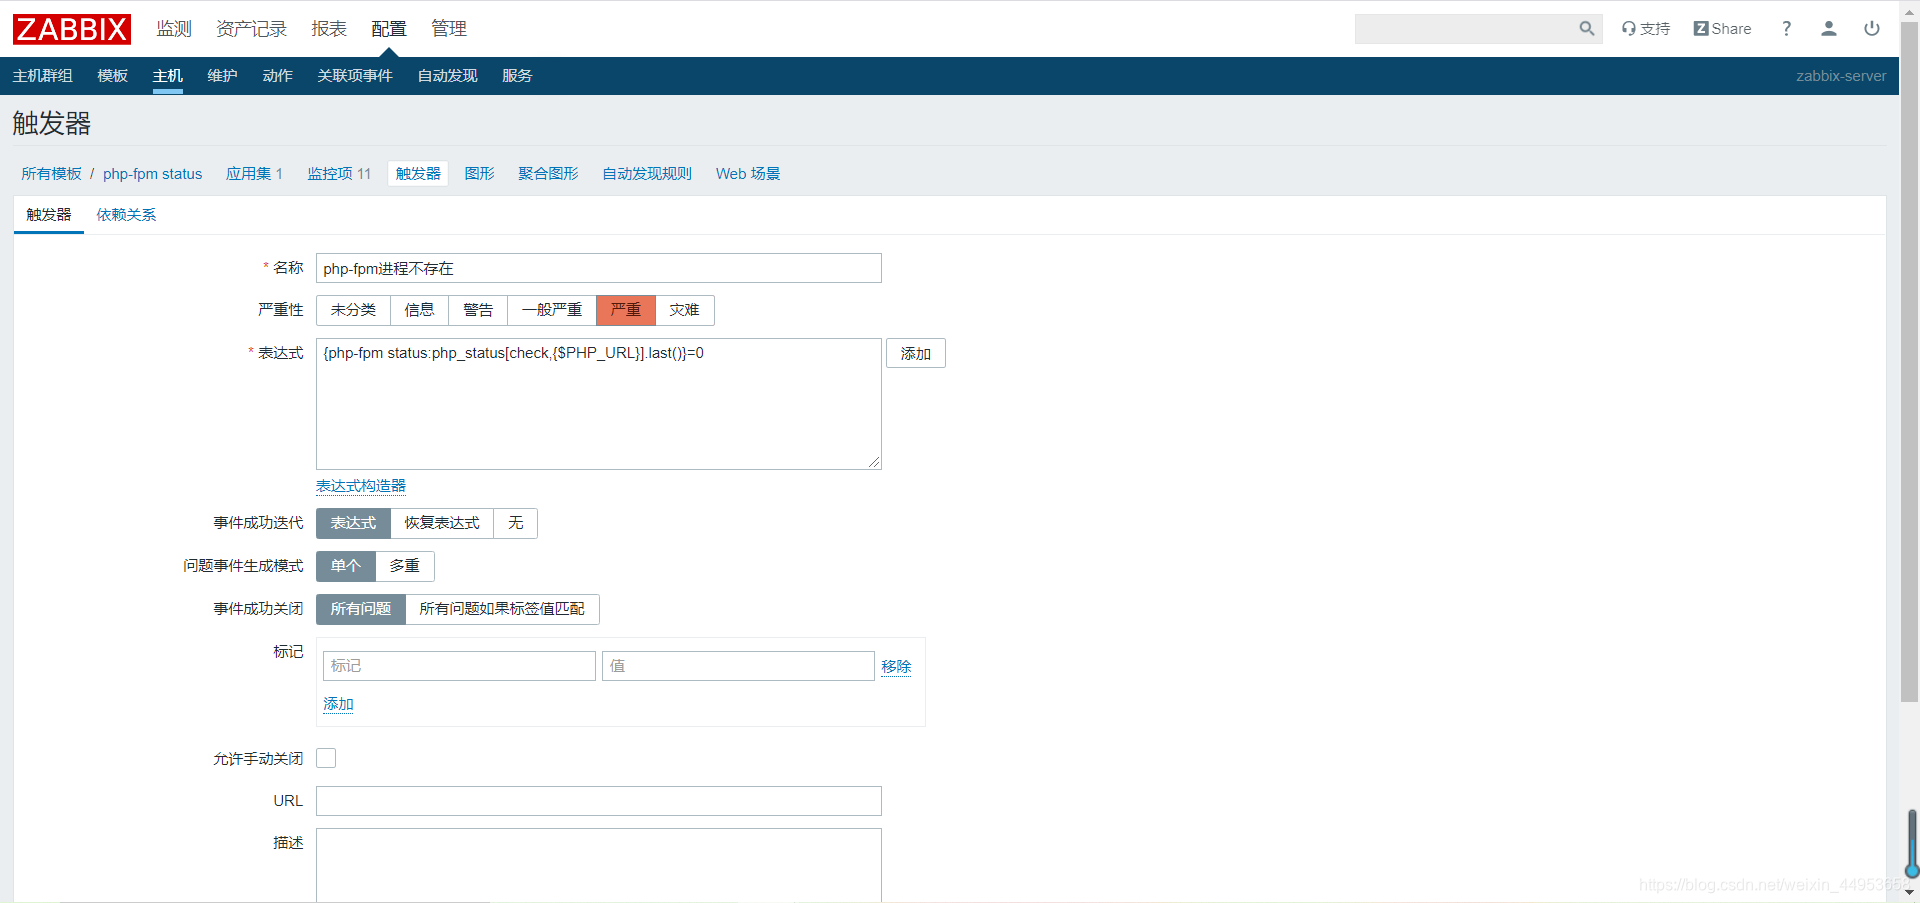
3.3.5.创建触发器
主要对php-fpm进程做一个触发器
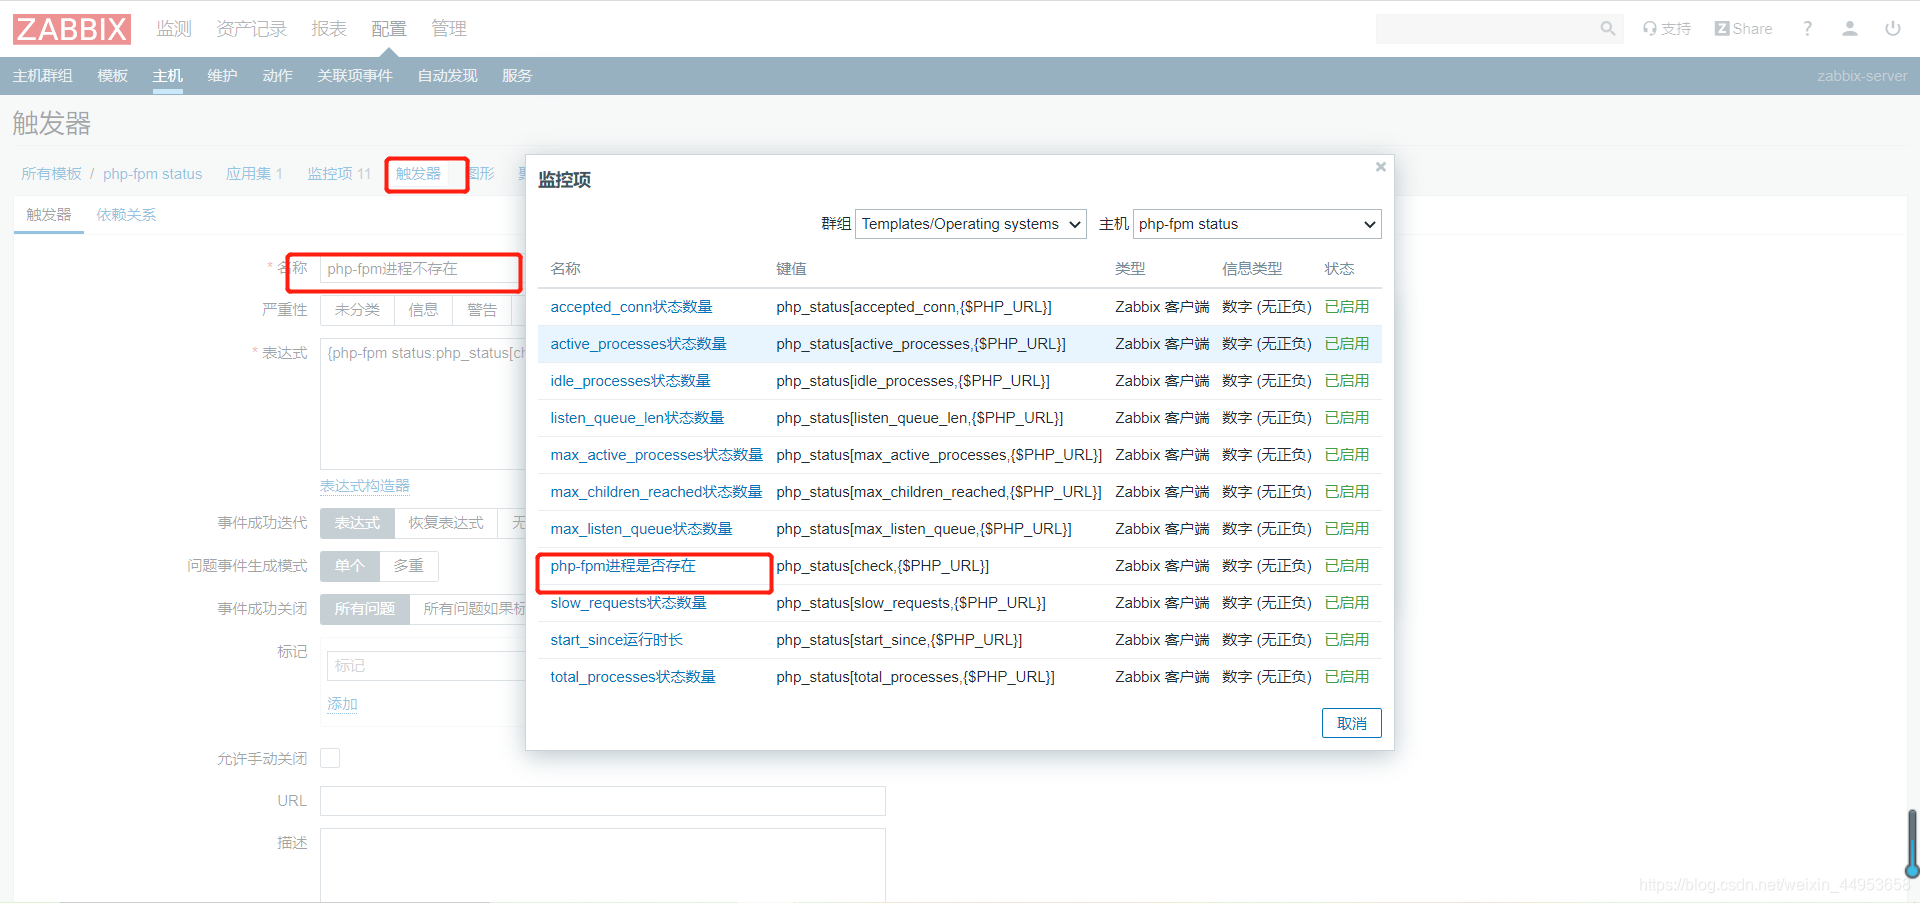
表达式
{php-fpm status:php_status[check,{$PHP_URL}].last()}=0
3.3.6.创建图形
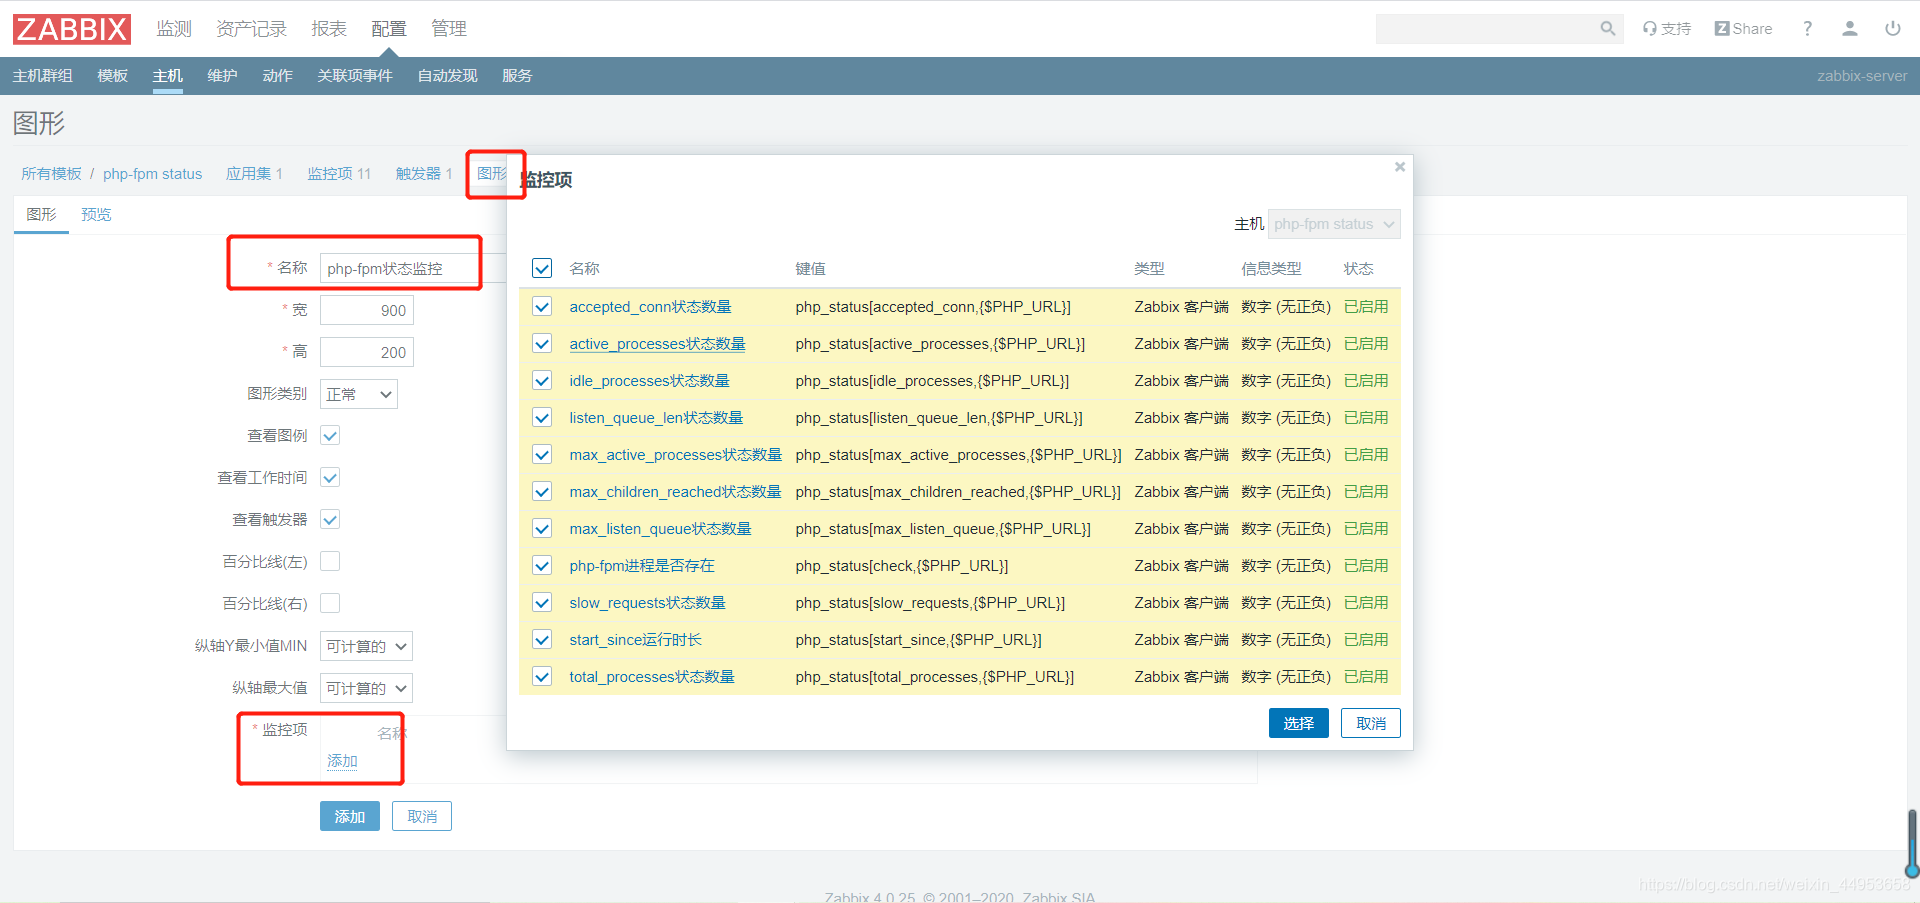
图形添加完毕
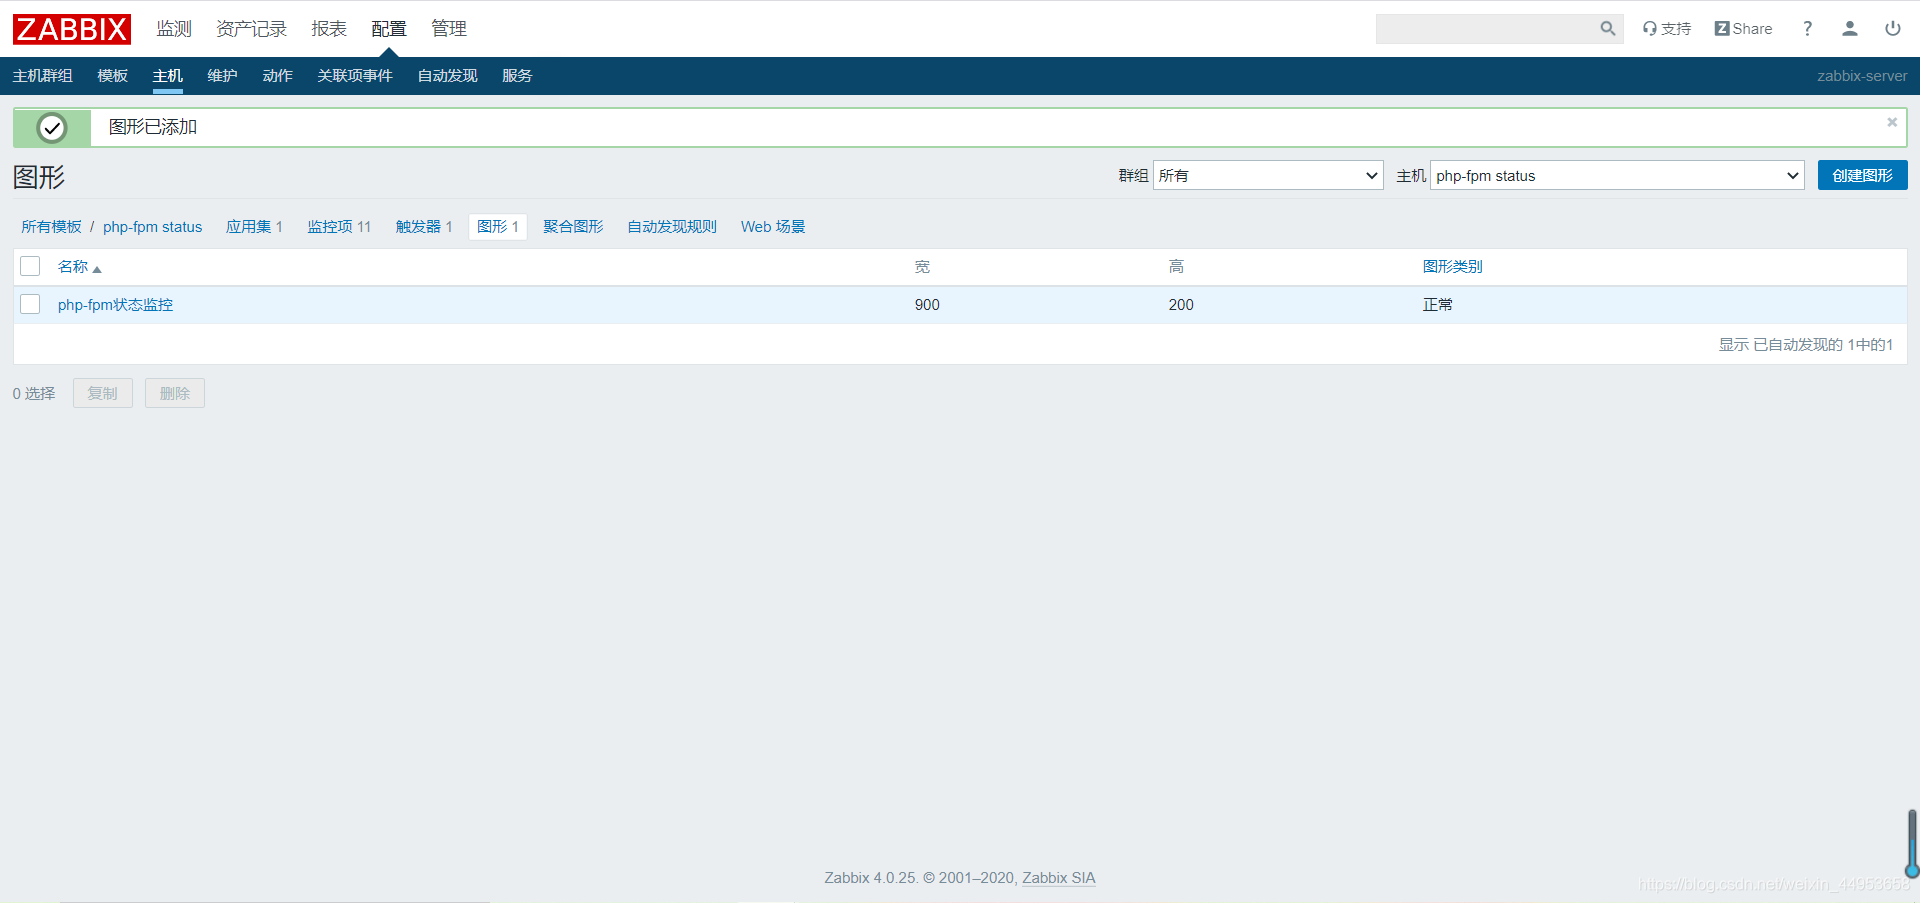
3.3.7.模板创建完成
4.监控主机应用php-fpm监控模板
配置—主机—模板—选择—添加—更新
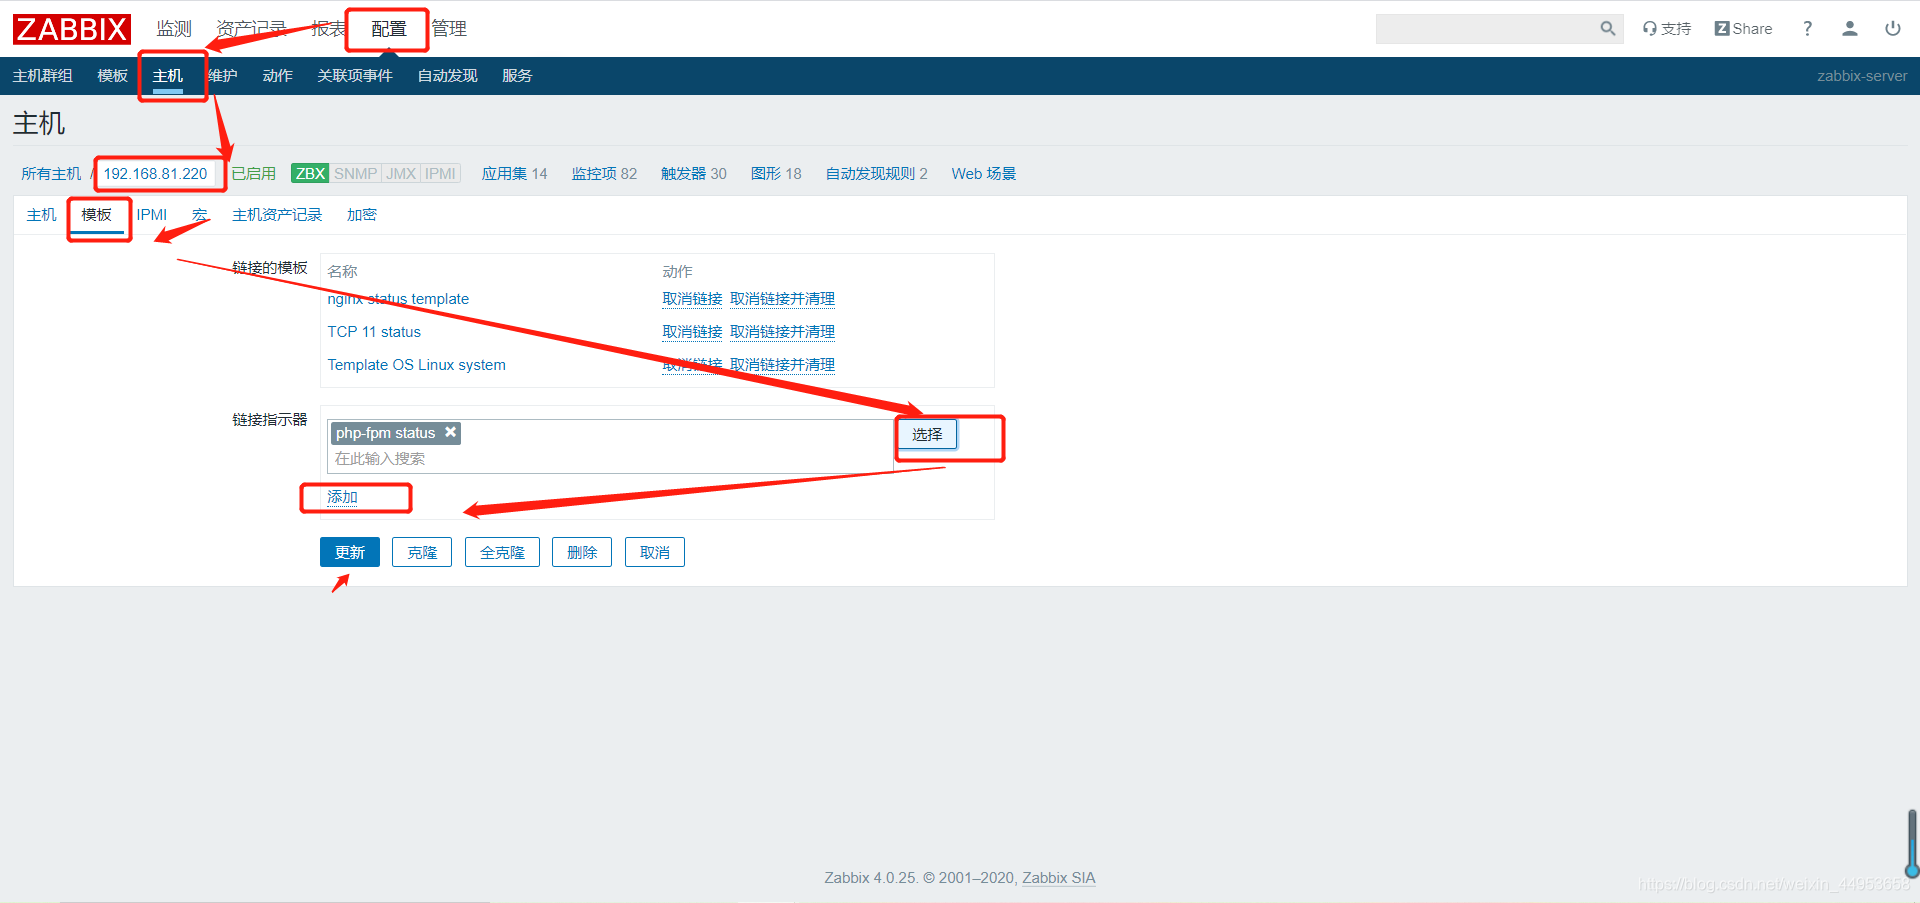
模板链接成功
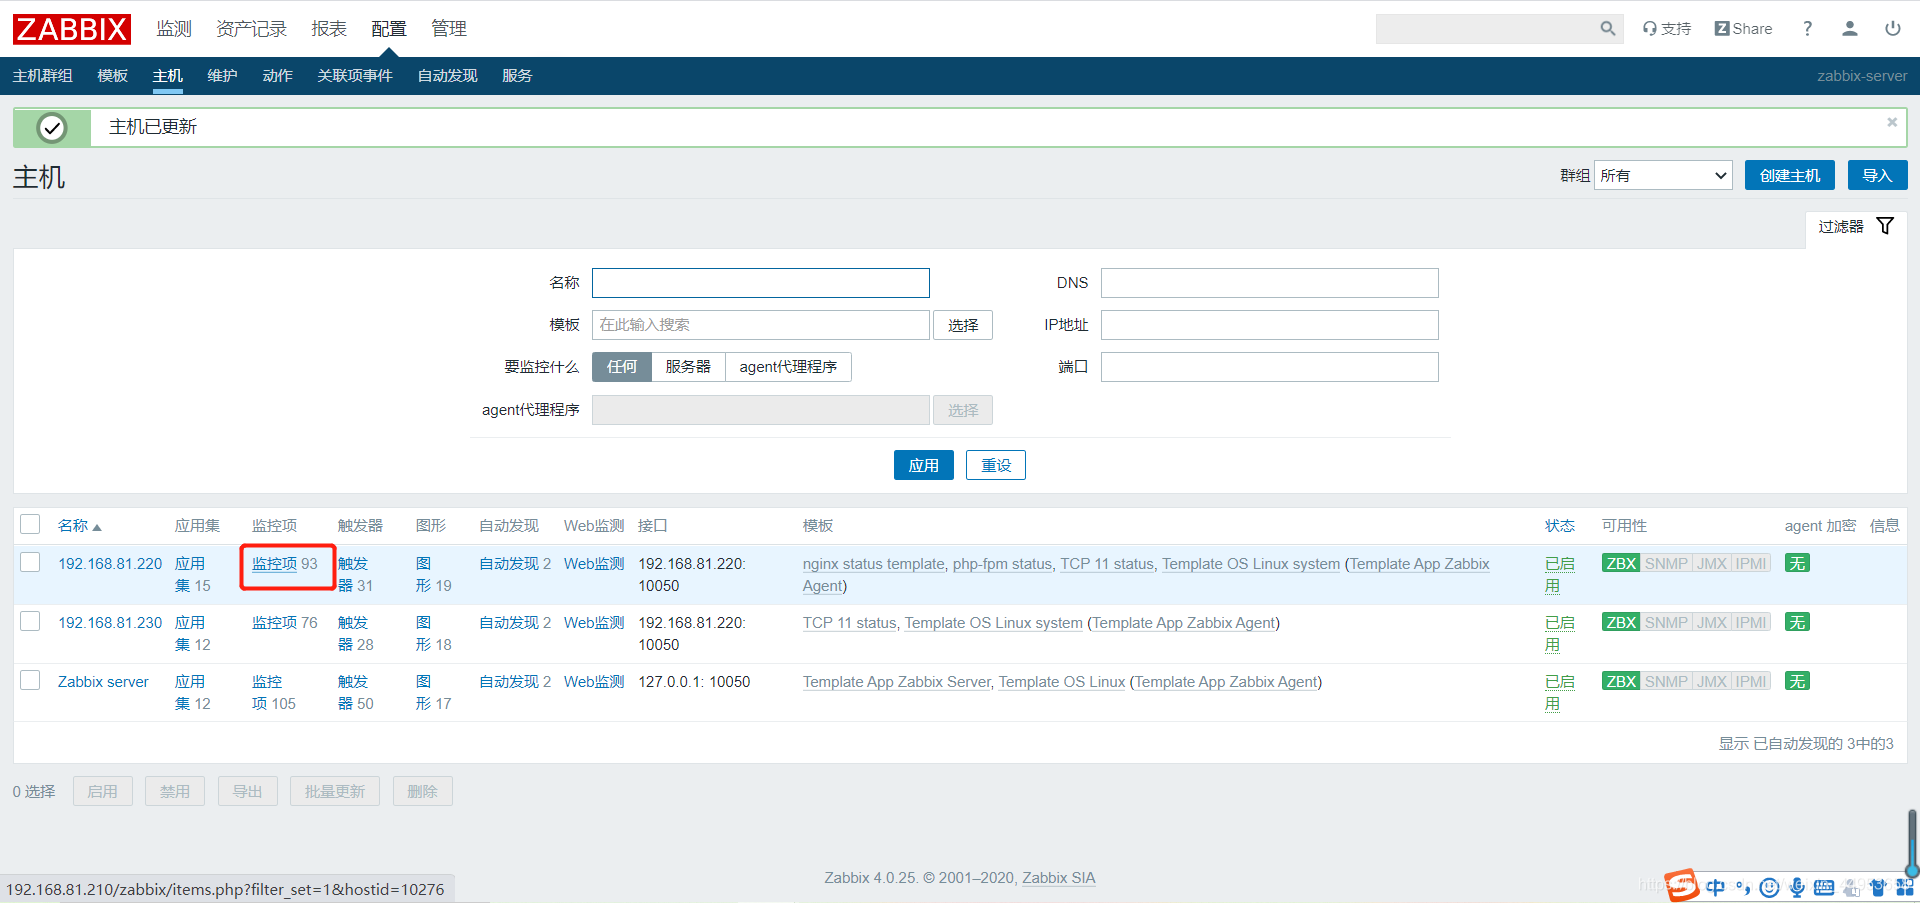
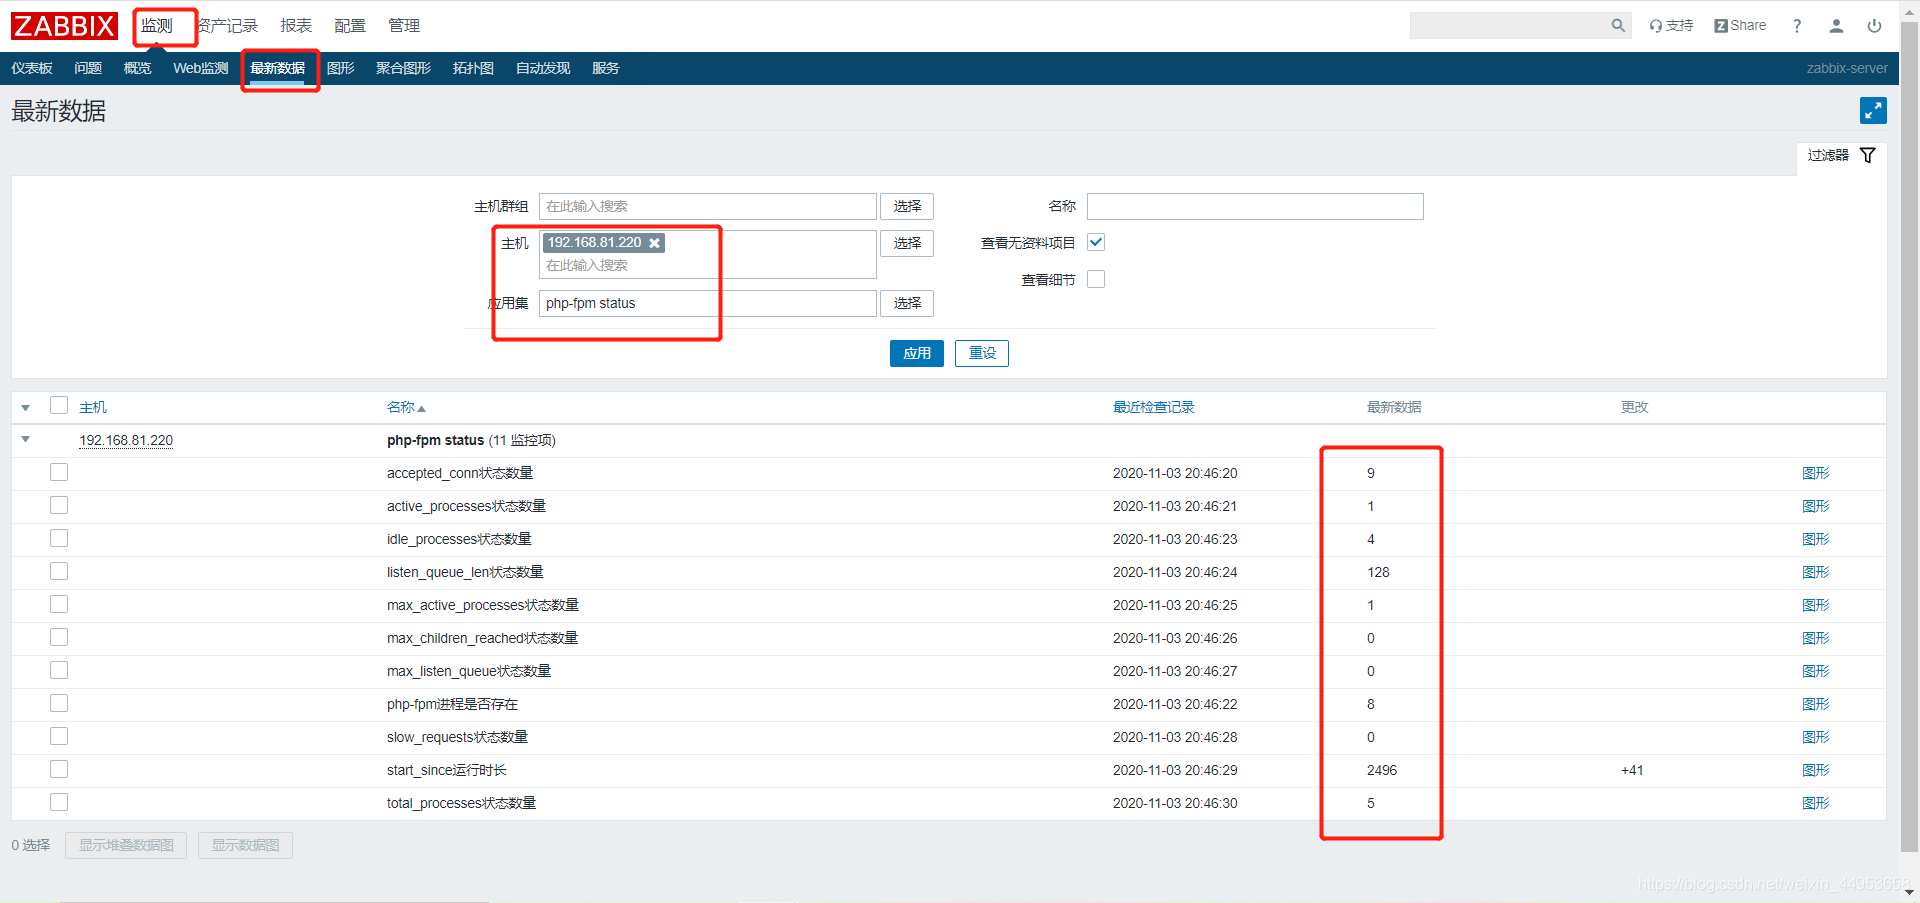
5.查看最新数据
监测—最新数据—选择主机—应用集
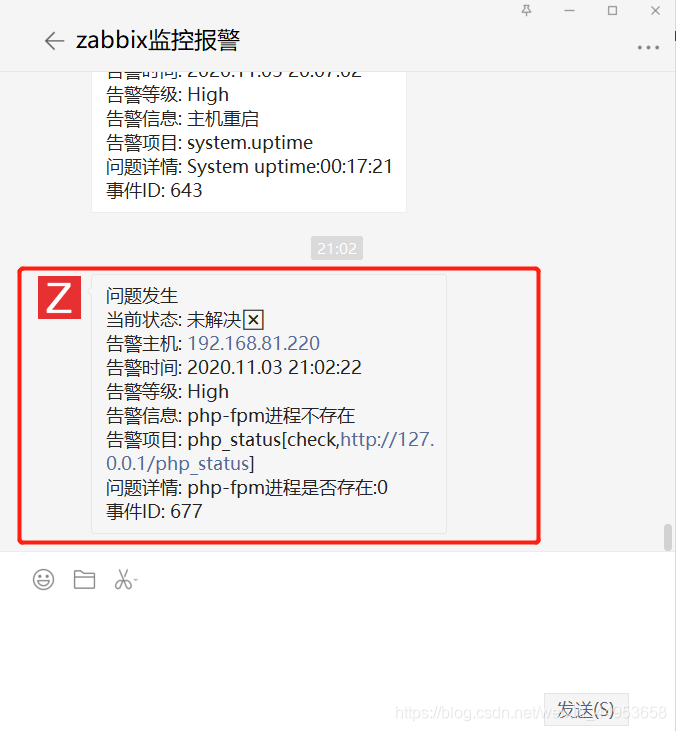
6.触发php-fpm进程存在并告警
[root@192_168_81_220 ~]# systemctl stop php-fpm

[root@192_168_81_220 ~]# ps aux | grep php | grep -v grep | grep -v php_status.sh | wc -l
0

进程数已经是0,坐等监控报警
仪表盘显示

报警短信
7.利用grafana生成php-fpm状态监控图形
7.1.创建图形
点击创建图形
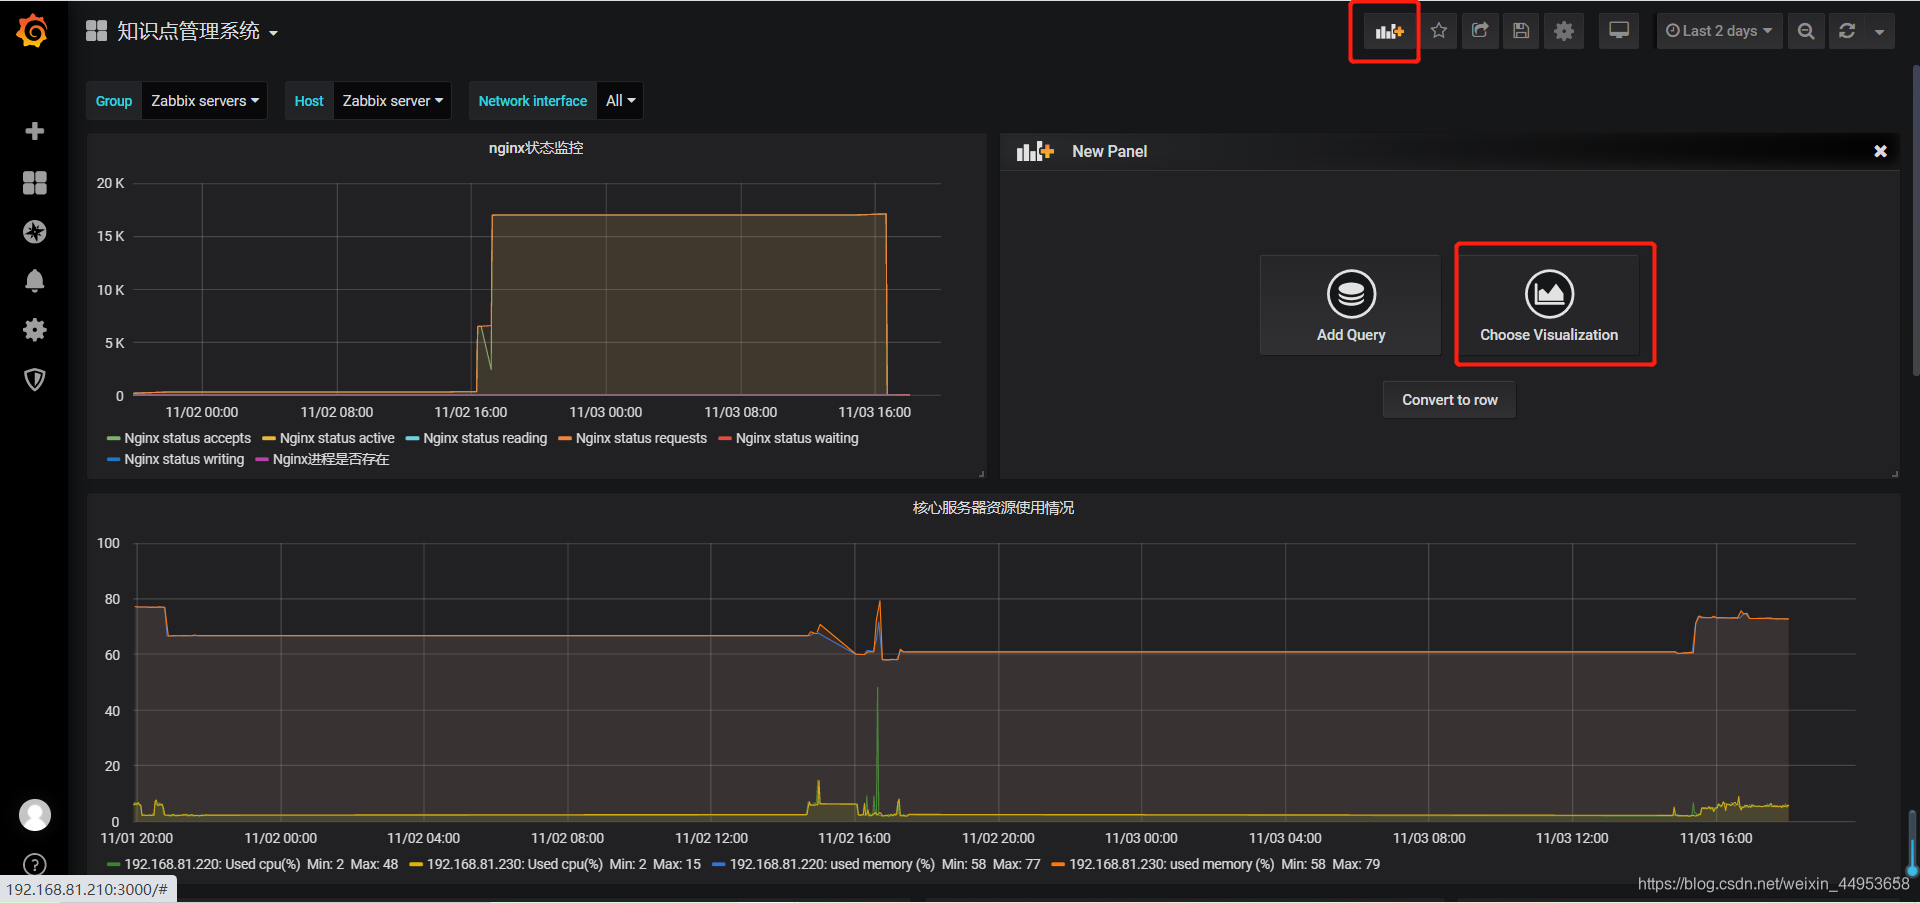
选择条形图
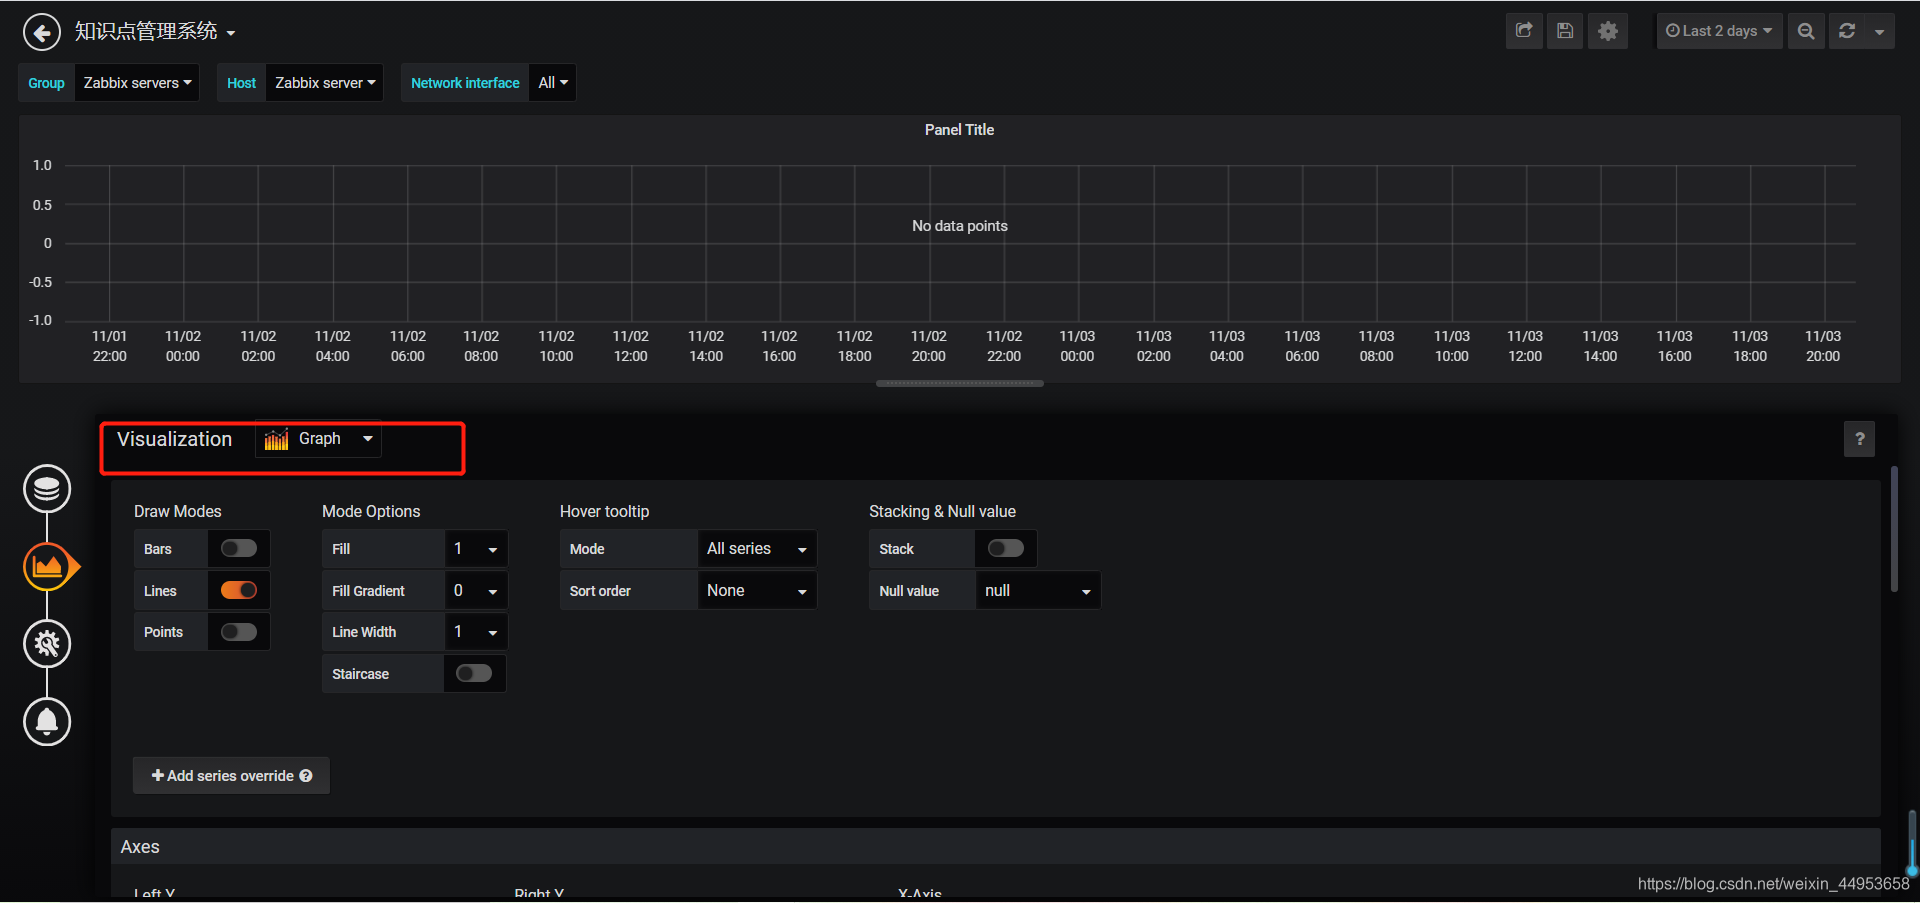
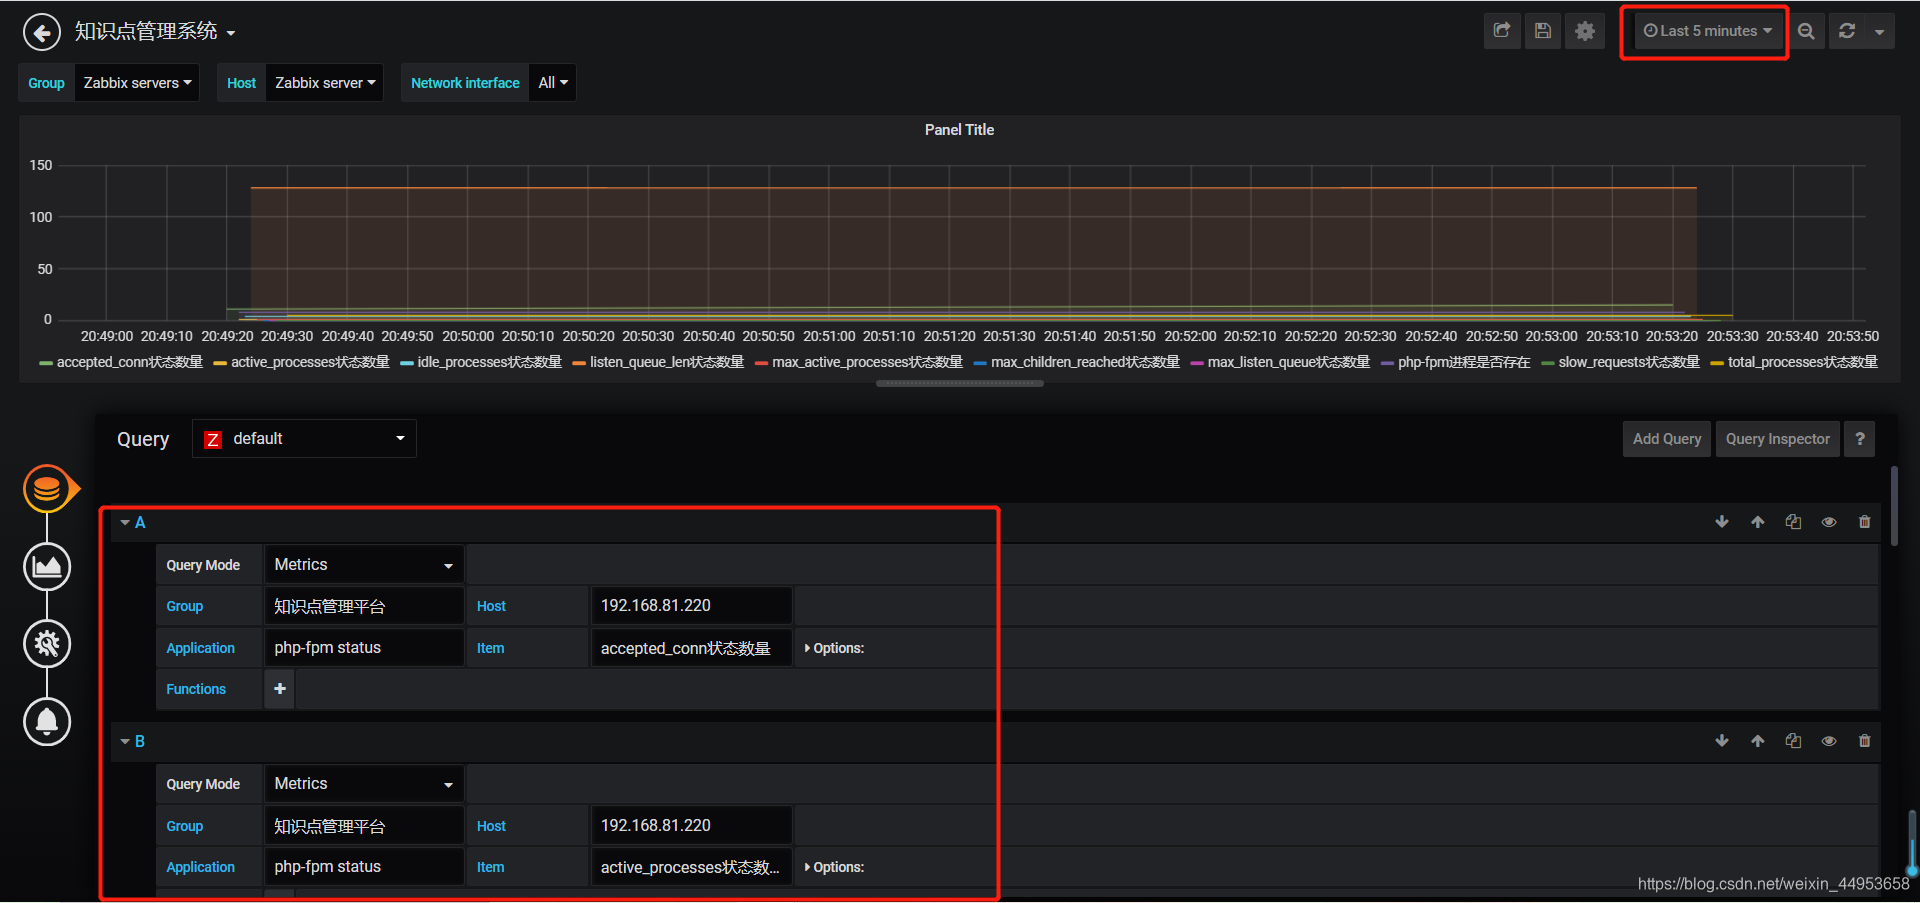
7.2.添加监控项
时间段选择5分钟内
这个图形不要添加运行时长那个监控项,因为会无限大
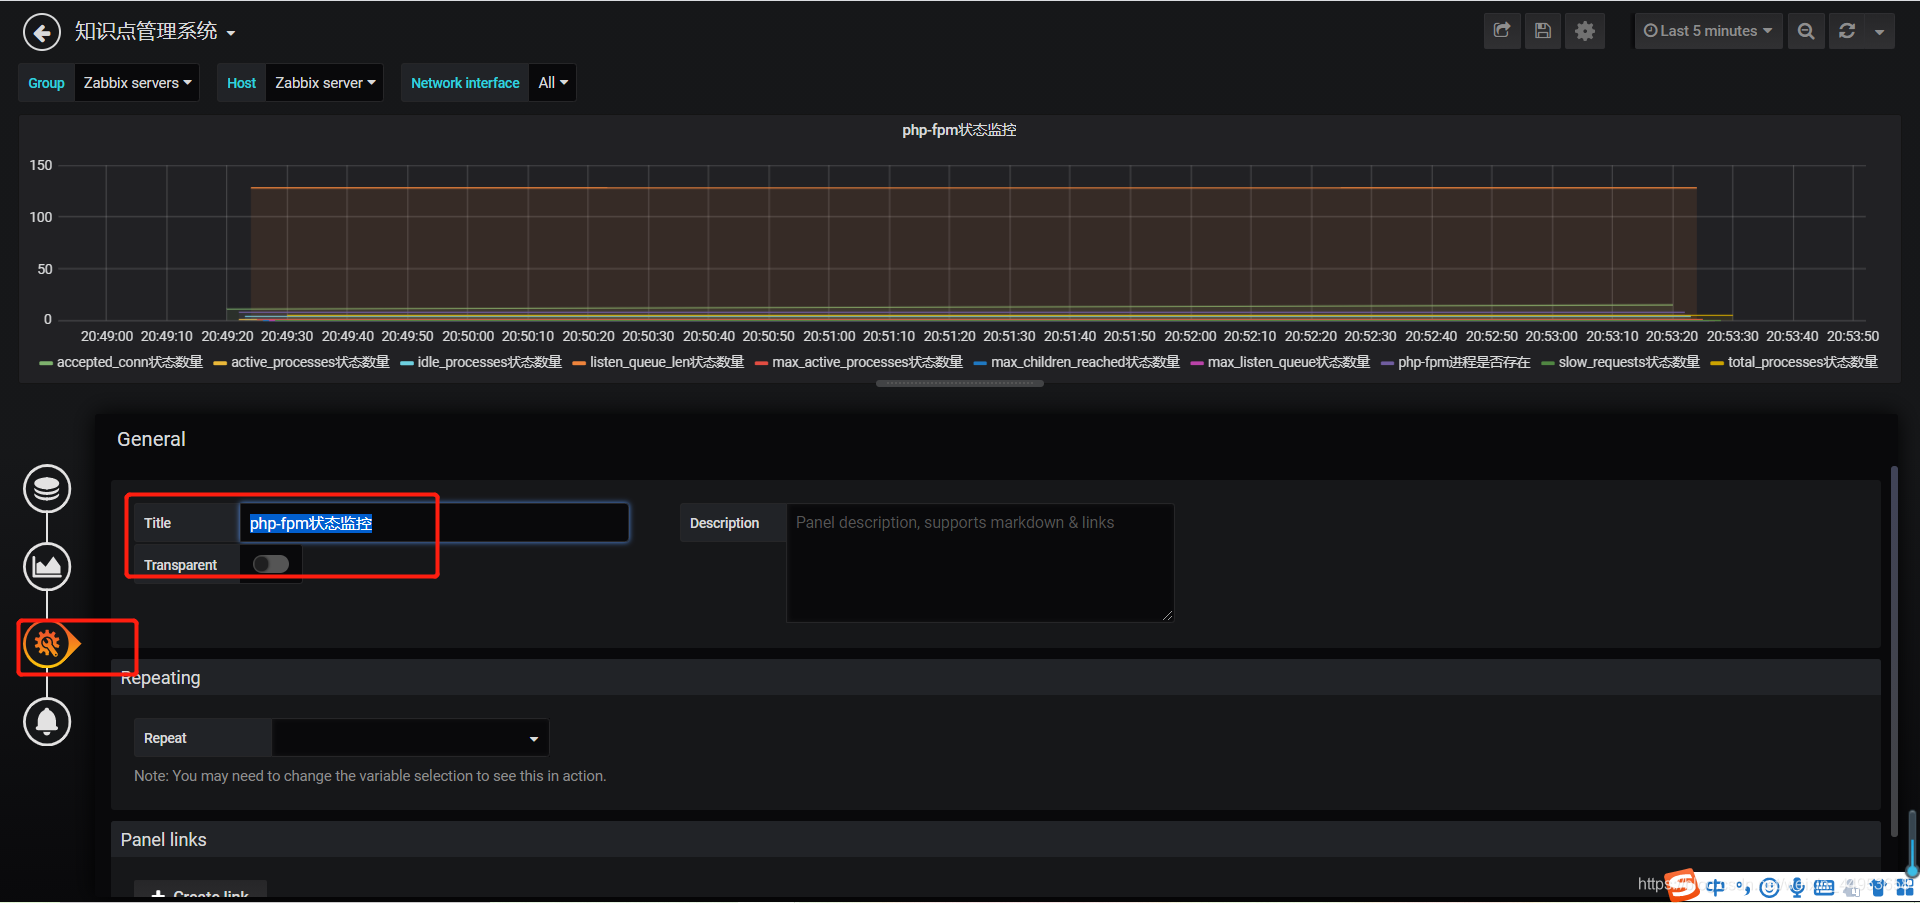
7.3.设置图形名称
第三个图标
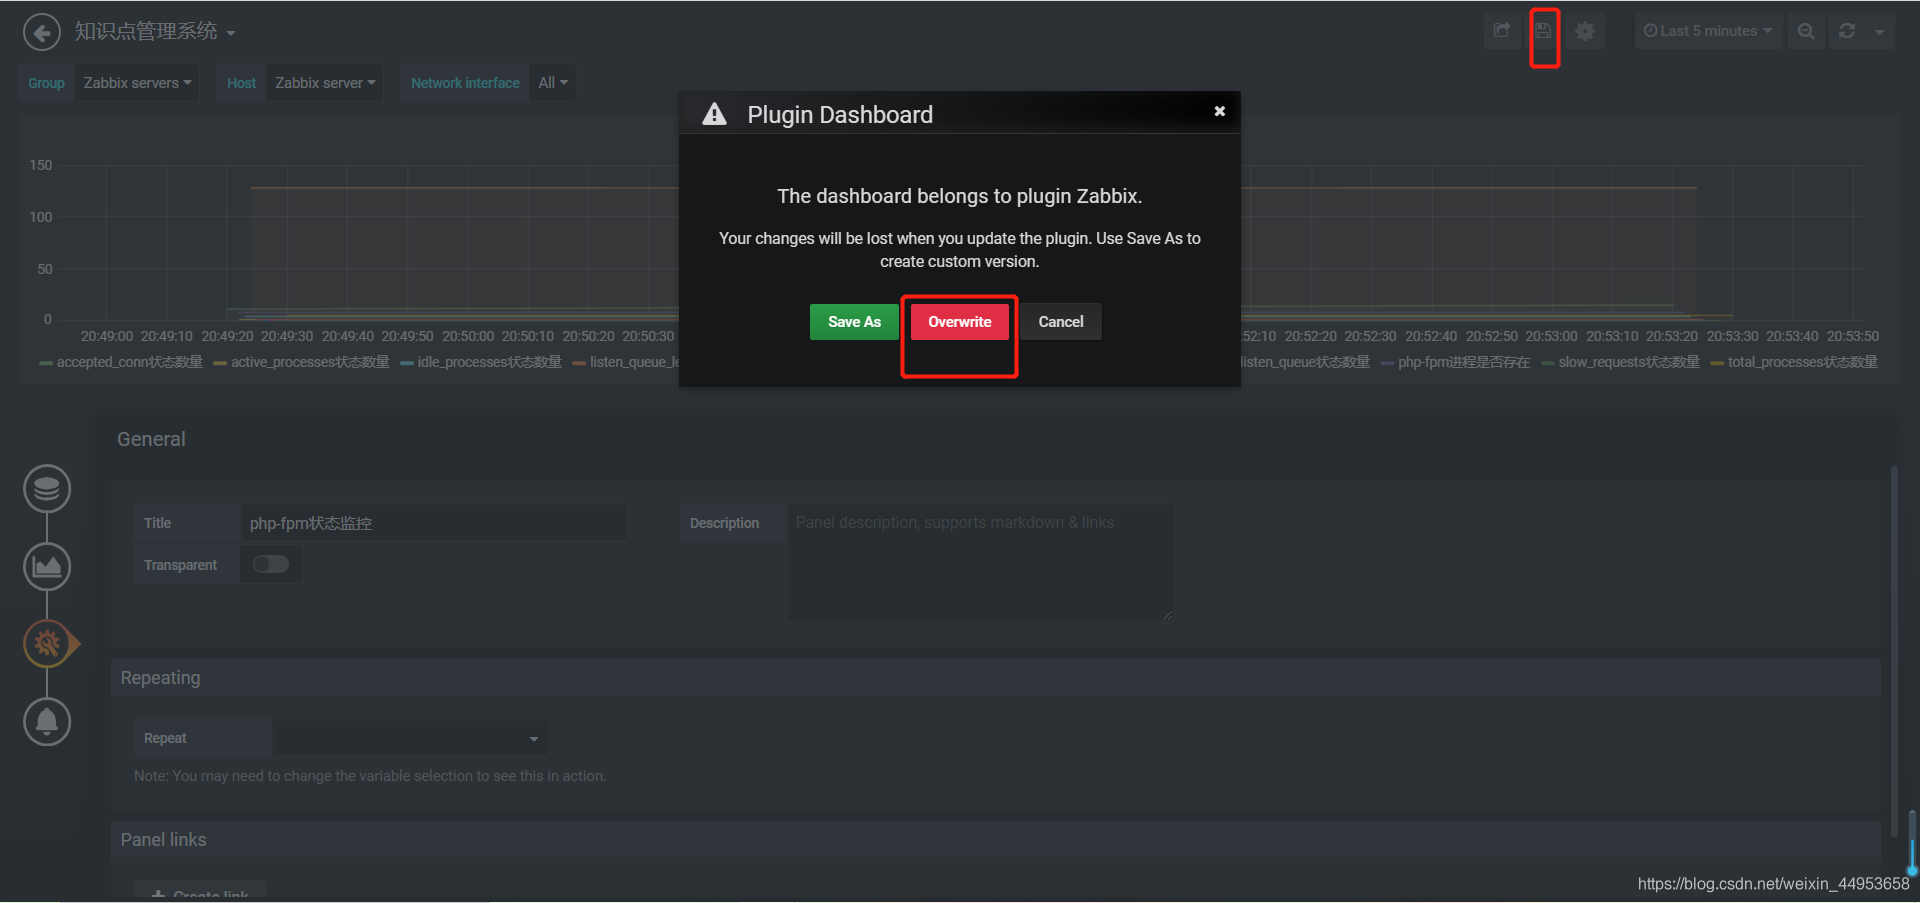
7.4.保存图形
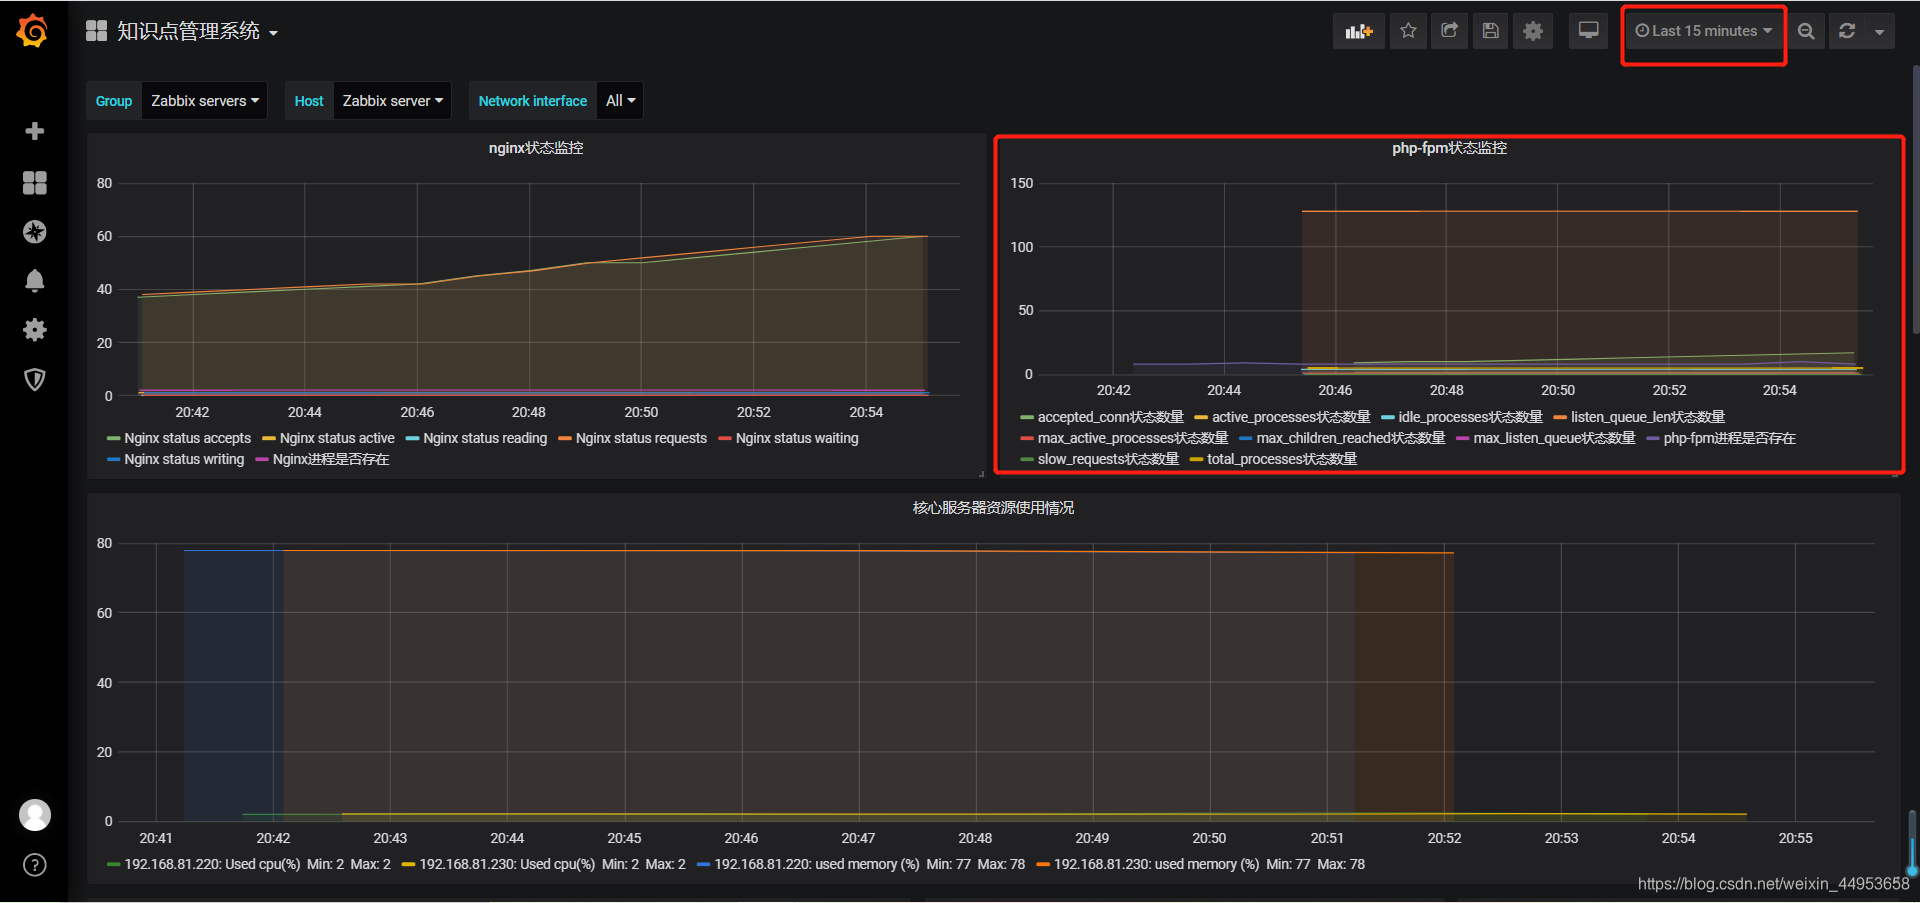
7.5.查看图形
查看最近15分钟的图形


 1740
1740


 被折叠的 条评论
为什么被折叠?
被折叠的 条评论
为什么被折叠?
 到【灌水乐园】发言


