


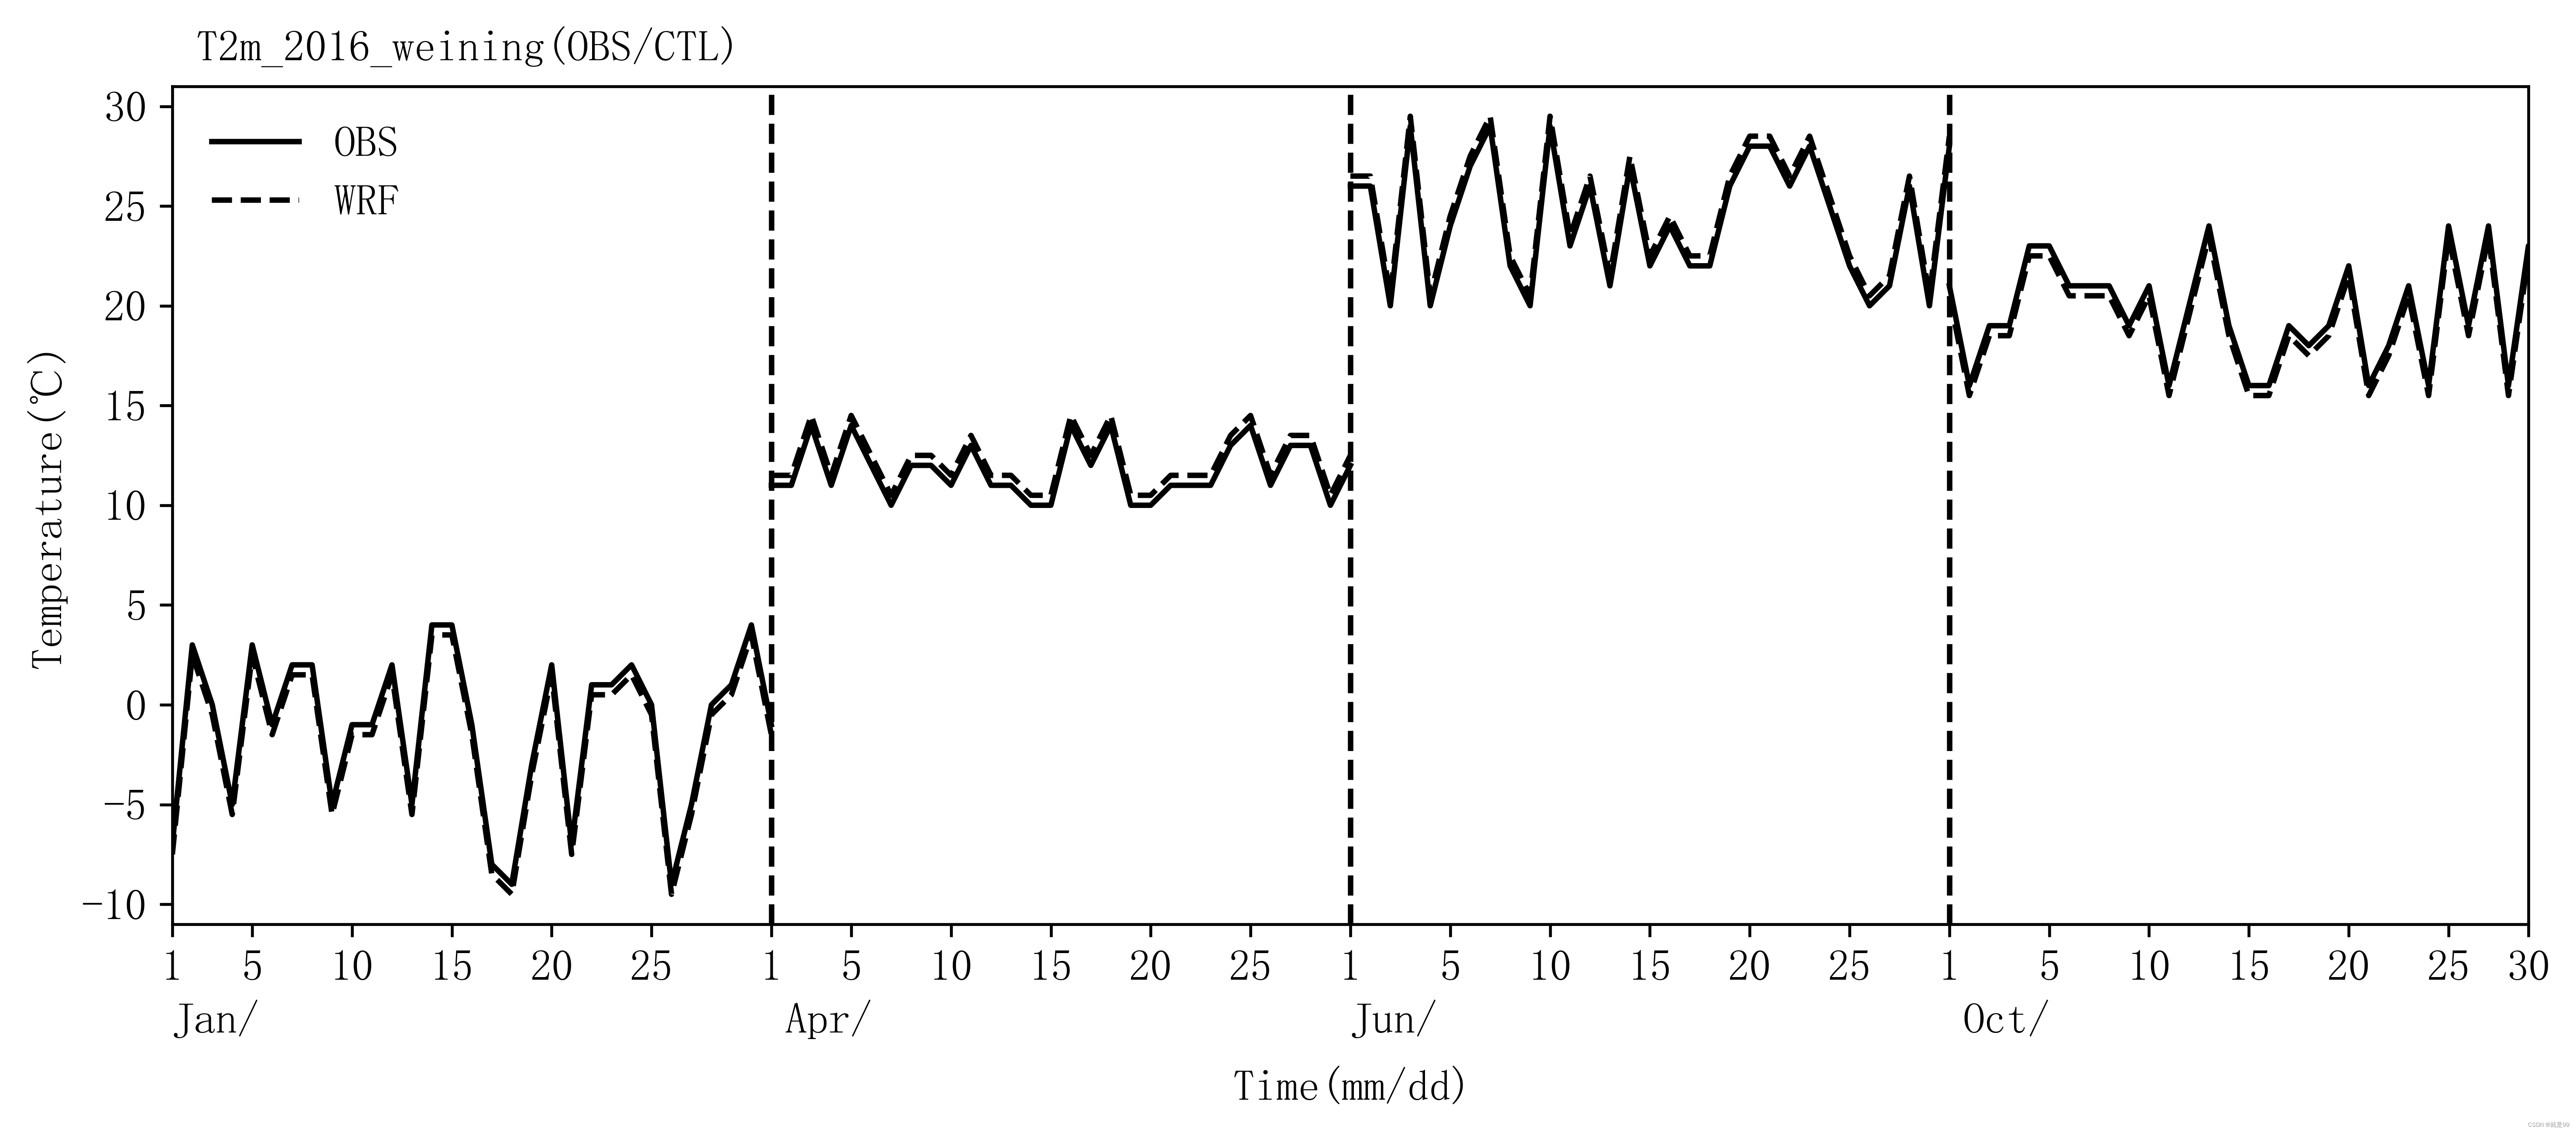
效果图:
主要步骤:
1. 数据准备:随机数组
2. 图像绘制:绘制间断的时间序列
详细代码:着急的直接拖到最后有完整代码
步骤一:导入库包及图片存储路径并设置中文字体为宋体,西文为新罗马(没有的库包要先下好奥)
###############################################################################
# 导入库包并设置字体
import numpy as np
import matplotlib.pyplot as plt

# 设置西文字体为新罗马字体,中文为宋体,字号为12
from matplotlib import rcParams
config = {
            "font.family": 'serif',
            "font.size": 12,
            "mathtext.fontset": 'stix',
            "font.serif": ['SimSun'],
          }
rcParams.update(config)
rcParams['axes.unicode_minus']=False
datapath = r'H:/00.csdn/01data/'
figpath = r'H:/00.csdn/02fig/'
shppath = r'H:/00.csdn/04shp/cn_shp/Province_9/Province_9.shp'
步骤二:随便生成数组,注意:x比y的个数少(月数-1)个,原因是有(n-1)个衔接(虚线那里)
###############################################################################
nday1 = 31
nday2 = 30
nday3 = 31
nday4 = 31
# 读入自己的数据
x = range(0, nday1 + nday2 + nday3 + nday4 - 3, 1)
y11 = np.random.randint(-10, 5, (nday1))
y12 = y11 - 0.5
y21 = np.random.randint(10, 15, (nday2))
y22 = y21 + 0.5
y31 = np.random.randint(20, 30, (nday3))
y32 = y31 + 0.5
y41 = np.random.randint(15, 25, (nday4))
y42 = y41 - 0.5
步骤三:绘制图像,主要是控制起始点x位置及x与y的个数匹配,并计算对应个点的真实日期
###############################################################################
# 画图
fig = plt.figure(figsize=(15, 8))
ax = fig.add_axes([0.1, 0.6, 0.6, 0.4])

ax.plot(x[0:nday1], y11, 'k-', label='OBS')
ax.plot(x[0:nday1], y12, 'k--', label='WRF')
ax.plot(x[nday1-1:nday1+nday2-1], y21, 'k-',)
ax.plot(x[nday1-1:nday1+nday2-1], y22, 'k--',)
ax.plot(x[nday1+nday2-2:nday1+nday2+nday3-2], y31, 'k-',)
ax.plot(x[nday1+nday2-2:nday1+nday2+nday3-2], y32, 'k--',)
ax.plot(x[nday1+nday2+nday3-3:], y41, 'k-',)
ax.plot(x[nday1+nday2+nday3-3:], y42, 'k--',)

ax.set(xlim=(0, 118),
        xticks=[0, 4, 9, 14, 19, 24, 30, 34, 39, 44, 49, 54,
                59, 64, 69, 74, 79, 84, 89, 94, 99, 104, 109, 114, 118],
        xticklabels=[1, 5, 10, 15, 20, 25, 1, 5, 10, 15, 20, 25,
                    1, 5, 10, 15, 20, 25, 1, 5, 10, 15, 20, 25, 30],

        ylim=(-11, 31),
        yticks=range(-10, 31, 5),
        yticklabels=range(-10, 31, 5),
        ylabel='Temperature(℃)',)
ax.text(x=0.01, y=1.03, s='T2m_2016_weining(OBS/CTL)', transform=ax.transAxes, fontsize=12)
ax.text(x=0.45, y=-0.21, s='Time(mm/dd)', transform=ax.transAxes, fontsize=12)
ax.text(x=0.00, y=-0.13, s='Jan/', transform=ax.transAxes, fontsize=12)
ax.text(x=0.26, y=-0.13, s='Apr/', transform=ax.transAxes, fontsize=12)
ax.text(x=0.5, y=-0.13, s='Jun/', transform=ax.transAxes, fontsize=12)
ax.text(x=0.76, y=-0.13, s='Oct/', transform=ax.transAxes, fontsize=12)

plt.axvline(x=30, color='k', linestyle='--')
plt.axvline(x=59, color='k', linestyle='--')
plt.axvline(x=89, color='k', linestyle='--')

ax.legend(frameon=False, fontsize=12)
步骤四:保存图像
###############################################################################
# 存图
plt.savefig(figpath+'214 断裂时间序列', dpi=600, bbox_inches = 'tight')
plt.show()
完整代码在这里:
###############################################################################
# 导入库包并设置字体
import numpy as np
import matplotlib.pyplot as plt

# 设置西文字体为新罗马字体,中文为宋体,字号为12
from matplotlib import rcParams
config = {
            "font.family": 'serif',
            "font.size": 12,
            "mathtext.fontset": 'stix',
            "font.serif": ['SimSun'],
          }
rcParams.update(config)
rcParams['axes.unicode_minus']=False
datapath = r'H:/00.csdn/01data/'
figpath = r'H:/00.csdn/02fig/'
shppath = r'H:/00.csdn/04shp/cn_shp/Province_9/Province_9.shp'
###############################################################################
nday1 = 31
nday2 = 30
nday3 = 31
nday4 = 31
# 读入自己的数据
x = range(0, nday1 + nday2 + nday3 + nday4 - 3, 1)
y11 = np.random.randint(-10, 5, (nday1))
y12 = y11 - 0.5
y21 = np.random.randint(10, 15, (nday2))
y22 = y21 + 0.5
y31 = np.random.randint(20, 30, (nday3))
y32 = y31 + 0.5
y41 = np.random.randint(15, 25, (nday4))
y42 = y41 - 0.5
###############################################################################
# 画图
fig = plt.figure(figsize=(15, 8))
ax = fig.add_axes([0.1, 0.6, 0.6, 0.4])

ax.plot(x[0:nday1], y11, 'k-', label='OBS')
ax.plot(x[0:nday1], y12, 'k--', label='WRF')
ax.plot(x[nday1-1:nday1+nday2-1], y21, 'k-',)
ax.plot(x[nday1-1:nday1+nday2-1], y22, 'k--',)
ax.plot(x[nday1+nday2-2:nday1+nday2+nday3-2], y31, 'k-',)
ax.plot(x[nday1+nday2-2:nday1+nday2+nday3-2], y32, 'k--',)
ax.plot(x[nday1+nday2+nday3-3:], y41, 'k-',)
ax.plot(x[nday1+nday2+nday3-3:], y42, 'k--',)

ax.set(xlim=(0, 118),
        xticks=[0, 4, 9, 14, 19, 24, 30, 34, 39, 44, 49, 54,
                59, 64, 69, 74, 79, 84, 89, 94, 99, 104, 109, 114, 118],
        xticklabels=[1, 5, 10, 15, 20, 25, 1, 5, 10, 15, 20, 25,
                    1, 5, 10, 15, 20, 25, 1, 5, 10, 15, 20, 25, 30],

        ylim=(-11, 31),
        yticks=range(-10, 31, 5),
        yticklabels=range(-10, 31, 5),
        ylabel='Temperature(℃)',)
ax.text(x=0.01, y=1.03, s='T2m_2016_weining(OBS/CTL)', transform=ax.transAxes, fontsize=12)
ax.text(x=0.45, y=-0.21, s='Time(mm/dd)', transform=ax.transAxes, fontsize=12)
ax.text(x=0.00, y=-0.13, s='Jan/', transform=ax.transAxes, fontsize=12)
ax.text(x=0.26, y=-0.13, s='Apr/', transform=ax.transAxes, fontsize=12)
ax.text(x=0.5, y=-0.13, s='Jun/', transform=ax.transAxes, fontsize=12)
ax.text(x=0.76, y=-0.13, s='Oct/', transform=ax.transAxes, fontsize=12)

plt.axvline(x=30, color='k', linestyle='--')
plt.axvline(x=59, color='k', linestyle='--')
plt.axvline(x=89, color='k', linestyle='--')

ax.legend(frameon=False, fontsize=12)
###############################################################################
# 存图
plt.savefig(figpath+'214 断裂时间序列', dpi=600, bbox_inches = 'tight')
plt.show()


 8496
8496

 被折叠的 条评论
为什么被折叠?
被折叠的 条评论
为什么被折叠?
 到【灌水乐园】发言


