


原文(需翻墙):http://javaeesupportpatterns.blogspot.com/2011/10/verbosegc-output-tutorial-java-7.html
Verbose output for the Java VM and garbage collection process has been around for quite a long time but I often get questions on how to read and interpret the output.
This short article will provide with a detailed tutorial on how to enable and read Java 7 HotSpot VM verbose gc output data.
I recommend that you compile and run the sample program on your end as well.
Tutorial specifications and tools
· OS: Windows 7 - 64-bit
· Java VM: Sun Java 7 HotSpot (build 21.0-b17)
· IDE: Eclipse Java EE IDE for Web Developer v4.1
Tutorial video available
We also recently created a Java verbose GC tutorial video explaining this analysis process.
Step #1 – Compile our sample Java program
We created a sample Java program in order to load the Java Heap and trigger an explicit GC in order to generate some interesting verbose GC output. This program is simply loading about 3 million instances of java.lang.String in a static Map data structure and triggers an explicit GC (via System.gc()) followed by the removal of 2 million instances along with a second explicit GC before exiting.
package org.ph.javaee.tools.jdk7;

import java.util.Map;
import java.util.HashMap;

/**
 * JavaHeapVerboseGCTest
 * @author Pierre-Hugues Charbonneau
 *
 */
public class JavaHeapVerboseGCTest {

       private static Map<String, String> mapContainer = new HashMap<String, String>();

       /**
        * @param args
        */
       public static void main(String[] args) {

             System.out.println("Java 7 HotSpot Verbose GC Test Program v1.0");
             System.out.println("Author: Pierre-Hugues Charbonneau");
             System.out.println("http://javaeesupportpatterns.blogspot.com/");

             String stringDataPrefix = "stringDataPrefix";

             // Load Java Heap with 3 M java.lang.String instances
             for (int i=0; i<3000000; i++) {
                    String newStringData = stringDataPrefix + i;
                    mapContainer.put(newStringData, newStringData);
             }

             System.out.println("MAP size: "+mapContainer.size());
             System.gc(); // Explicit GC!

             // Remove 2 M out of 3 M
             for (int i=0; i<2000000; i++) {
                    String newStringData = stringDataPrefix + i;
                    mapContainer.remove(newStringData);
             }

             System.out.println("MAP size: "+mapContainer.size());
             System.gc();
             System.out.println("End of program!");

       }
}
Step #2 – Enable verbose GC via the JVM start-up arguments
The next step is to enable the verbose GC via the JVM start-up arguments and specify a name and location for our GC log file.
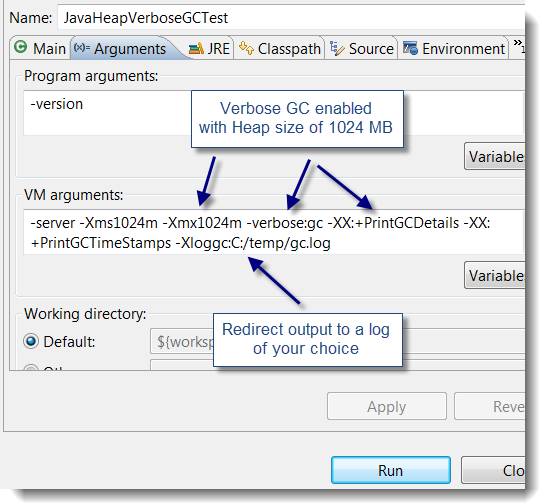
Step #3 – Execute our sample Java program
At this point, it is now time to execute our sample program and generate the JVM verbose GC output.

Verbose GC output high level analysis
It is now time to review the generated GC output.
First, let’s start with the raw data. As you can see below, the GC output is divided into 3 main sections:
· 5 Minor collections (YoungGen space collections) identified as
PSYoungGen
· 2 Major collections (triggered by System.gc()) identified as
Full GC (System)
· A detailed
Java Heap breakdown of each memory space
0.437: [GC [
PSYoungGen: 262208K->43632K(305856K)]
262208K->137900K(1004928K), 0.1396040 secs]
[Times: user=0.45 sys=0.01, real=0.14 secs]
0.785: [GC [
PSYoungGen: 305840K->43640K(305856K)]
400108K->291080K(1004928K), 0.2197630 secs]
[Times: user=0.56 sys=0.03, real=0.22 secs]
1.100: [GC [
PSYoungGen: 164752K->43632K(305856K)]
412192K->340488K(1004928K), 0.0878209 secs]
[Times: user=0.37 sys=0.00, real=0.09 secs]
1.188: [
Full GC (System) [PSYoungGen: 43632K->0K(305856K)]
[PSOldGen: 296856K->340433K(699072K)]
340488K->340433K(1004928K)
[PSPermGen: 1554K->1554K(16384K)], 0.4053311 secs]
[Times: user=0.41 sys=0.00, real=0.40 secs]
1.883: [GC [
PSYoungGen: 262208K->16K(305856K)]
602641K->340449K(1004928K), 0.0326756 secs]
[Times: user=0.09 sys=0.00, real=0.03 secs]
2.004: [GC [
PSYoungGen: 92122K->0K(305856K)]
432556K->340433K(1004928K), 0.0161477 secs]
[Times: user=0.06 sys=0.00, real=0.02 secs]
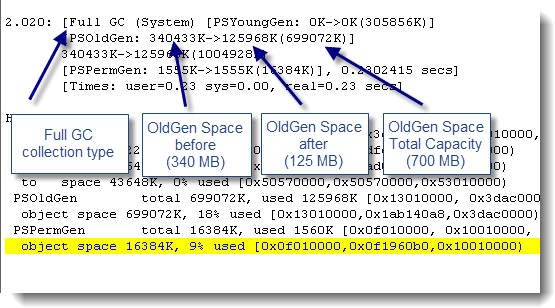
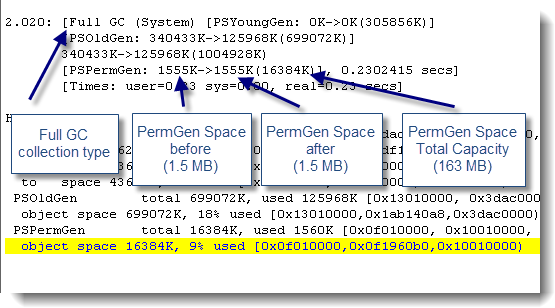
2.020: [
Full GC (System) [PSYoungGen: 0K->0K(305856K)]
[PSOldGen: 340433K->125968K(699072K)]
340433K->125968K(1004928K)
[PSPermGen: 1555K->1555K(16384K)], 0.2302415 secs]
[Times: user=0.23 sys=0.00, real=0.23 secs]
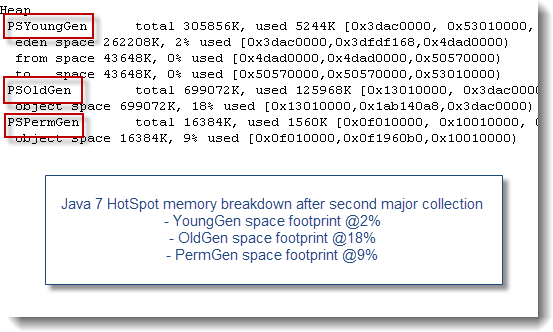
Heap
PSYoungGen total 305856K, used 5244K [0x3dac0000, 0x53010000, 0x53010000)
eden space 262208K, 2% used [0x3dac0000,0x3dfdf168,0x4dad0000)
from space 43648K, 0% used [0x4dad0000,0x4dad0000,0x50570000)
to space 43648K, 0% used [0x50570000,0x50570000,0x53010000)
PSOldGen total 699072K, used 125968K [0x13010000, 0x3dac0000, 0x3dac0000)
object space 699072K, 18% used [0x13010000,0x1ab140a8,0x3dac0000)
PSPermGen total 16384K, used 1560K [0x0f010000, 0x10010000, 0x13010000)
object space 16384K, 9% used [0x0f010000,0x0f1960b0,0x10010000)
Verbose GC data interpretation and sequence
As you can see from the verbose GC output, the OldGen space was at 340 MB after the initial loading of 3 M String instances in our HashMap. It did go down to 126 MB following the removal of 2 M String instances.
Now find below explanation and snapshots on how you can read the GC output data in more detail for each Java Heap space.
## YoungGen space analysis

## OldGen space analysis
## PermGen space analysis
## Java Heap breakdown analysis
Conclusion
I hope this sample Java program and verbose GC output analysis has helped you understand how to read and interpret this critical data. Please do not hesitate to post any comment or question. My next article will cover the verbose GC for the IBM Java JRE.


 5148
5148

 被折叠的 条评论
为什么被折叠?
被折叠的 条评论
为什么被折叠?
 到【灌水乐园】发言


