这是非常好的一篇文章,可以认为是我做数据分析的转折点,为什么呢?
因为这是我做数据分析第一次引入SQL语句,然后爱不释手;结合SQL语句返回结果进行数据分析的效果真的很好,很多大神看到可能会笑话晚辈,但是如果你是数据分析的新人,那我强烈推荐,尤其是结合网络爬虫进行数据分析的。希望这篇文章对你有所帮助,如果文章中存在错误或不足之处,还请高抬贵手~
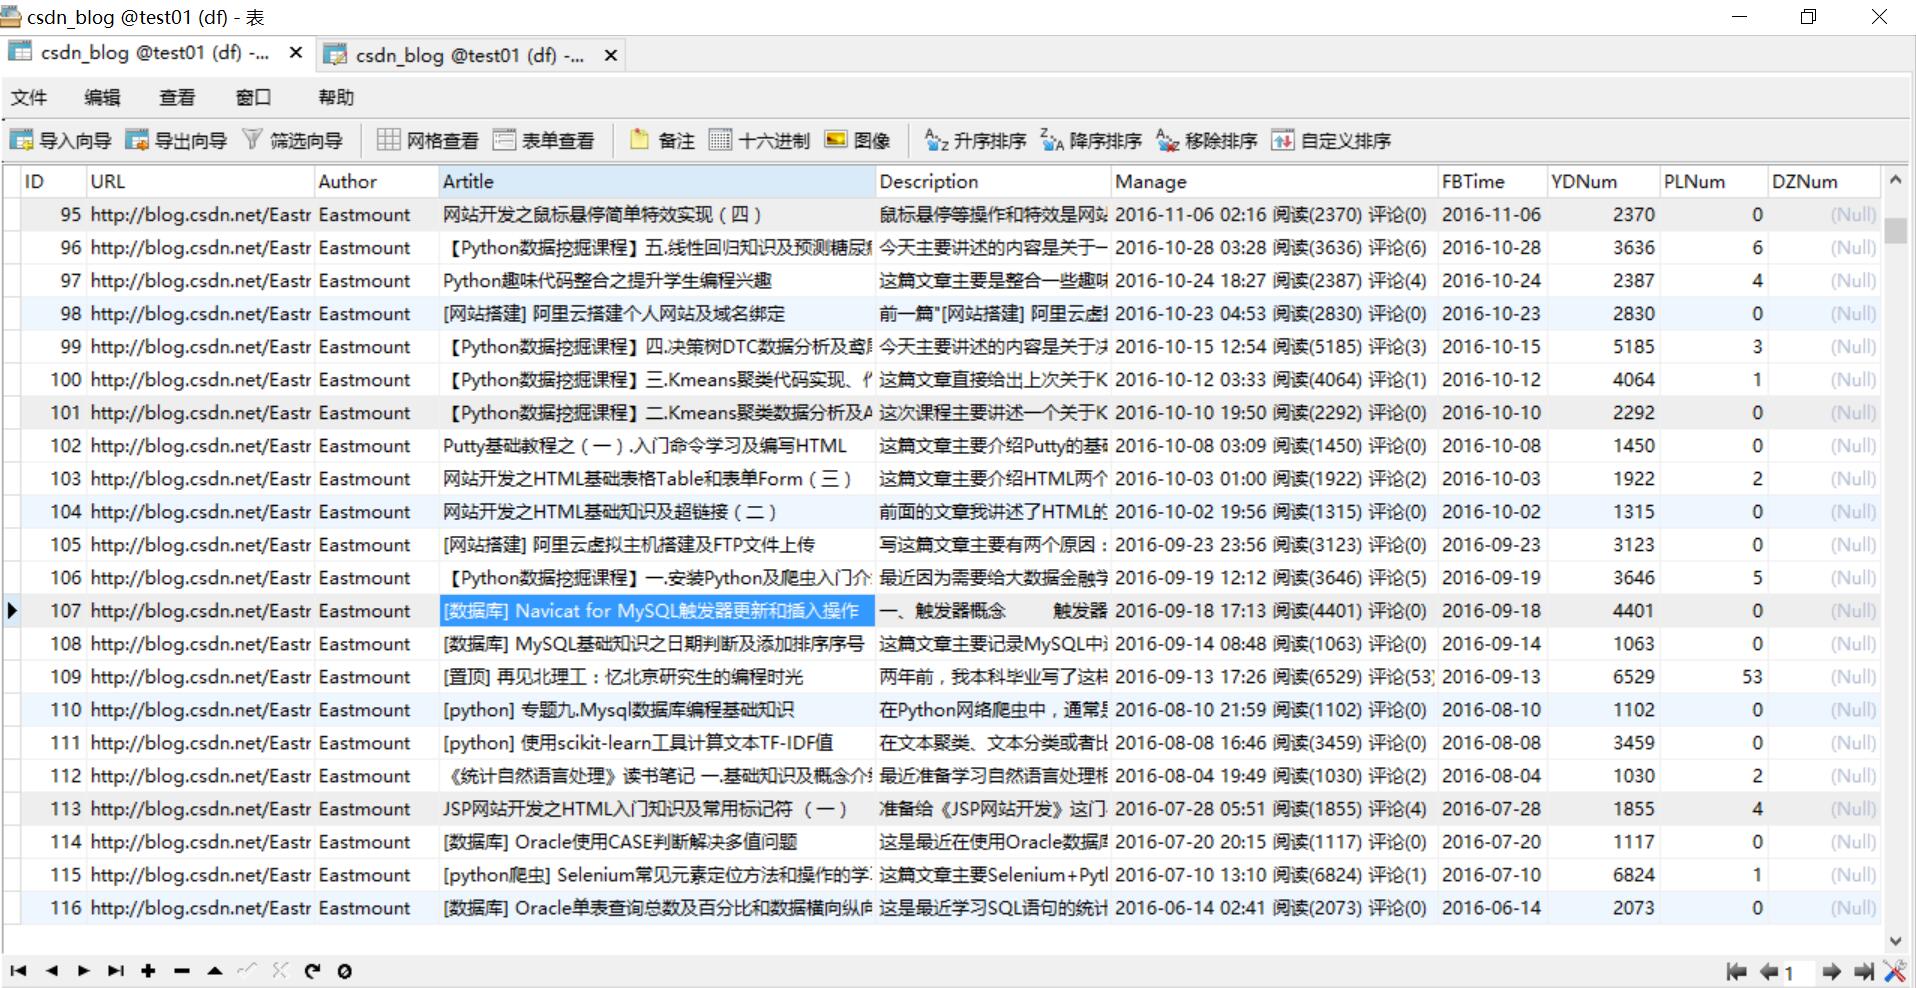
1.MySQL数据库知识 首先在"[python爬虫] Selenium爬取内容并存储至MySQL数据库 "这篇文章中我讲述了爬虫爬取数据并存储在MySQL 中,如下图所示,我的所有博客文章。
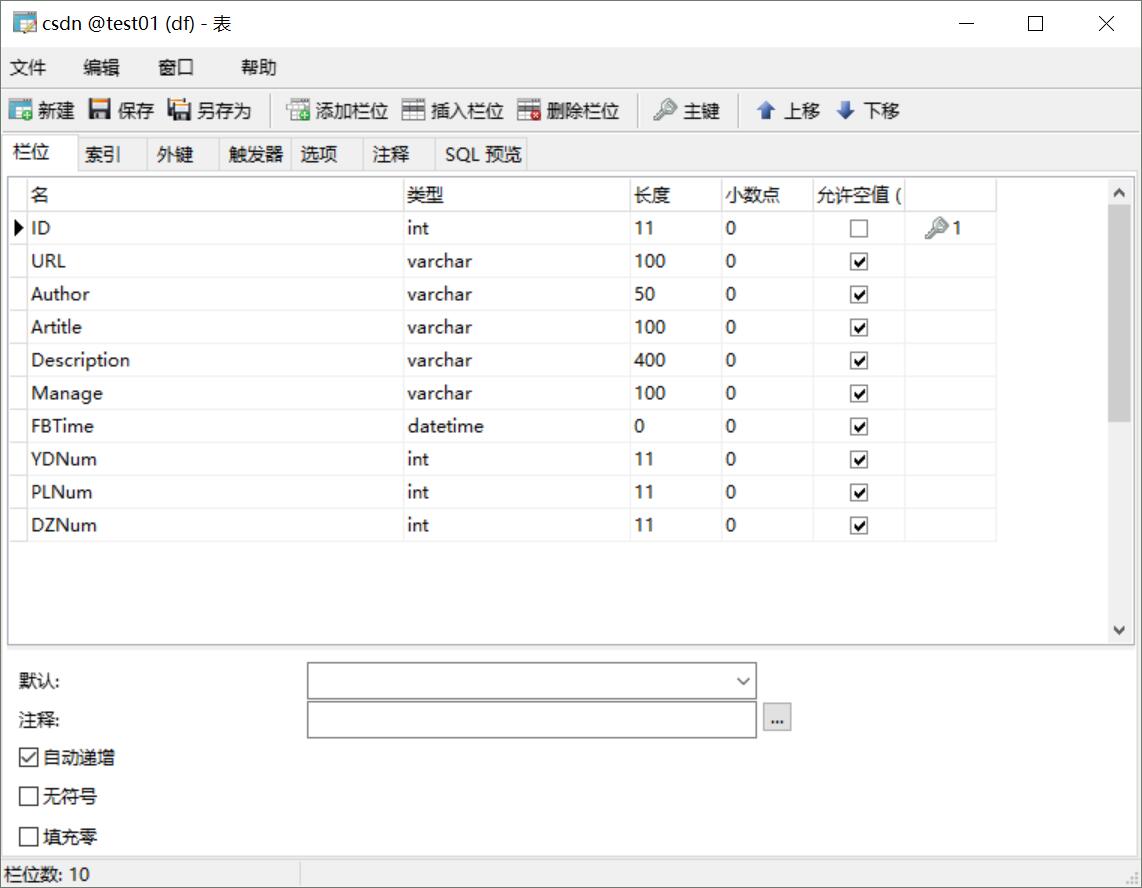
数据库 表csdn内容如下所示:
CREATE TABLE `csdn` ( `ID` int (11) NOT NULL AUTO_INCREMENT, `URL` varchar (100) COLLATE utf8_bin DEFAULT NULL , `Author` varchar (50) COLLATE utf8_bin DEFAULT NULL COMMENT '作者' , `Artitle` varchar (100) COLLATE utf8_bin DEFAULT NULL COMMENT '标题' , `Description` varchar (400) COLLATE utf8_bin DEFAULT NULL COMMENT '摘要' , `Manage` varchar (100) COLLATE utf8_bin DEFAULT NULL COMMENT '信息' , `FBTime` datetime DEFAULT NULL COMMENT '发布日期' , `YDNum` int (11) DEFAULT NULL COMMENT '阅读数' , `PLNum` int (11) DEFAULT NULL COMMENT '评论数' , `DZNum` int (11) DEFAULT NULL COMMENT '点赞数' , PRIMARY KEY (`ID`) ) ENGINE=InnoDB AUTO_INCREMENT=9371 DEFAULT CHARSET=utf8 COLLATE =utf8_bin;
运行结果如下图所示:
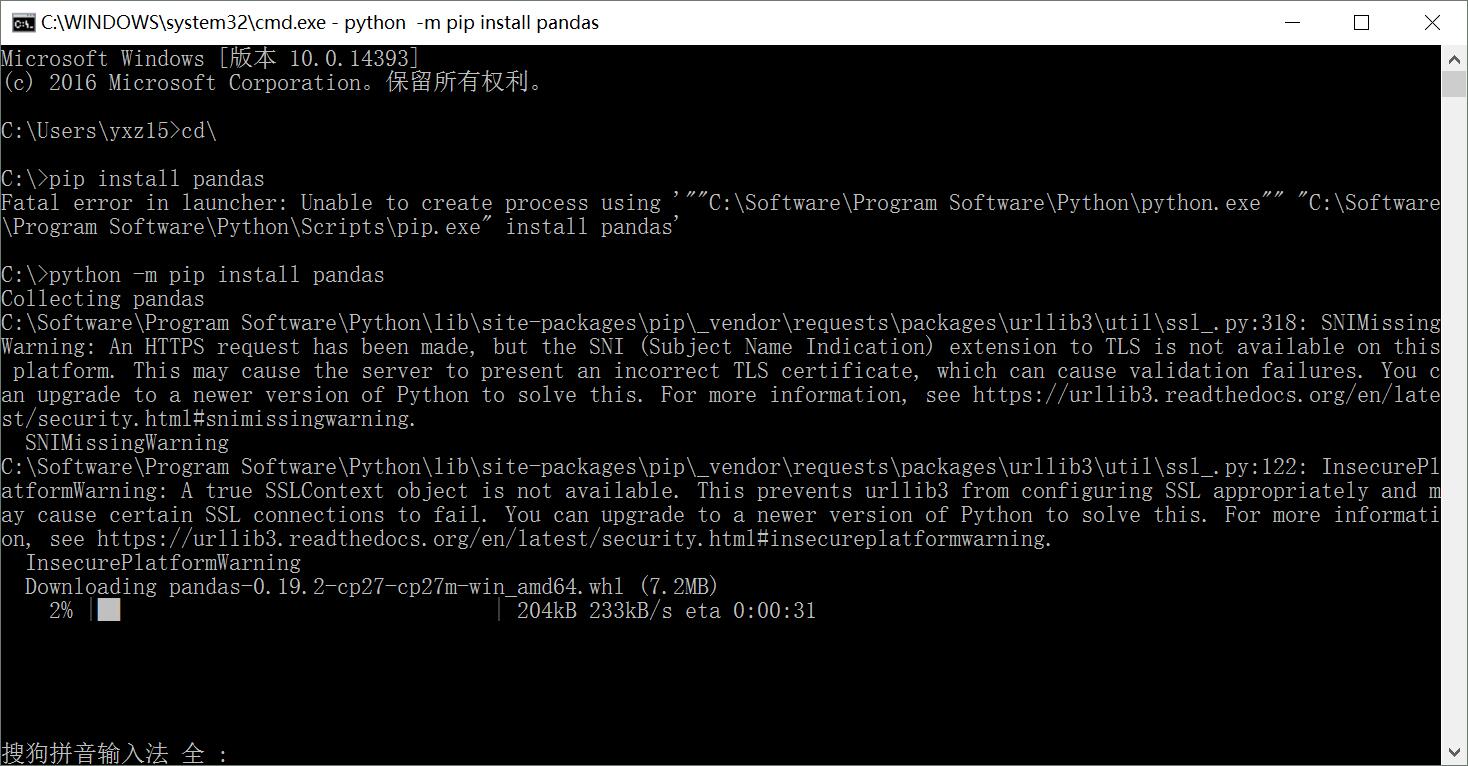
Python .exe“ ”C:\Program Files (x86)\Python33\pip.exe“使用下面的命令安装。
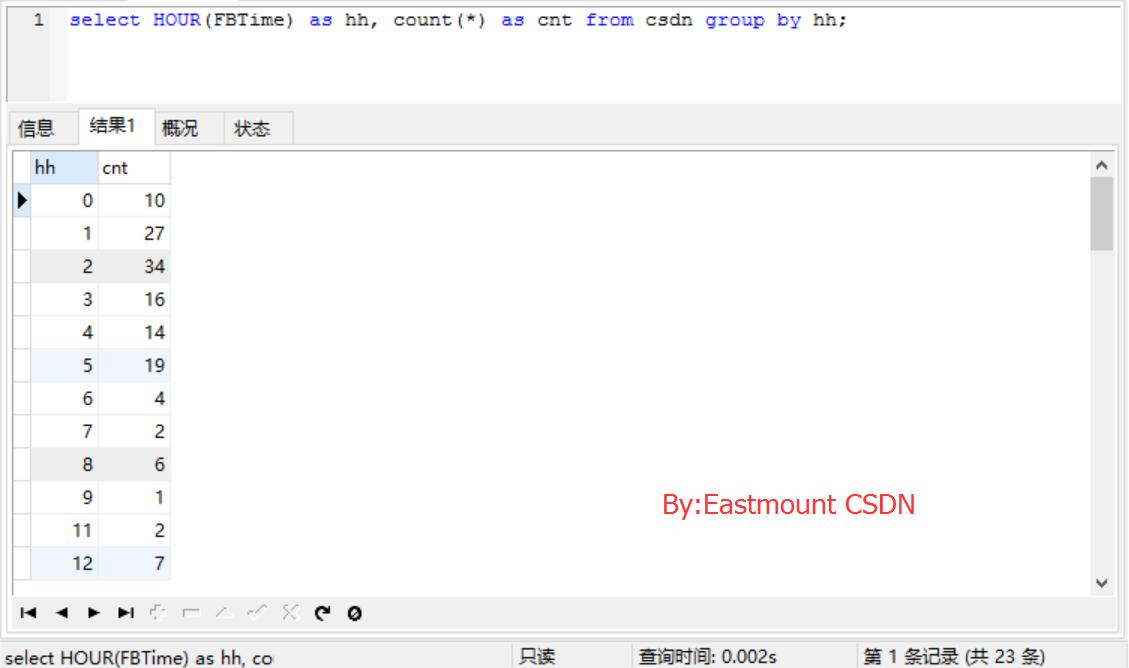
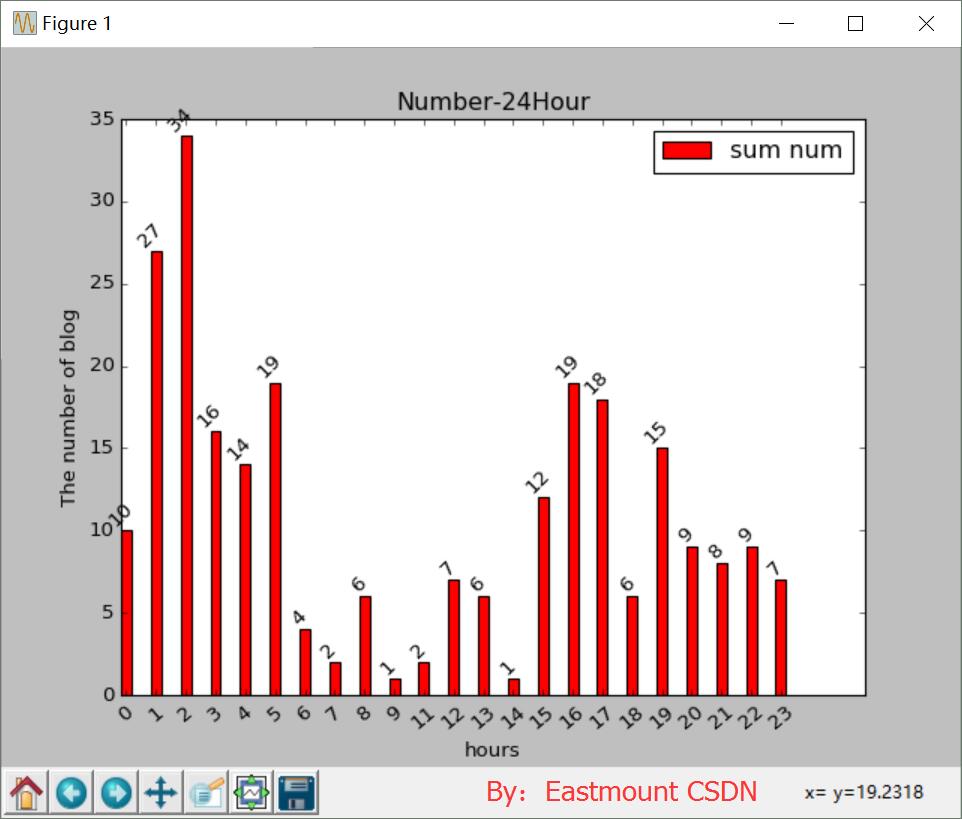
2.绘制24小时博客对比 SQL语句如下:
select HOUR(FBTime) as hh, count(*) as cnt from csdn group by hh;
分析博主24小时写博客的个时间段的博客数量:
代码如下所示:
'' import matplotlib.pyplot as plt import matplotlib import pandas as pd import numpy as np import pylab import MySQLdb from pylab import * try : conn = MySQLdb.connect(host='localhost' ,user= 'root' , passwd='123456' ,port= 3306 , db= 'test01' ) cur = conn.cursor() conn.set_character_set('utf8' ) cur.execute('SET NAMES utf8;' ) cur.execute('SET CHARACTER SET utf8;' ) cur.execute('SET character_set_connection=utf8;' ) sql = "select HOUR(FBTime) as hh, count(*) as cnt from csdn group by hh;" cur.execute(sql) result = cur.fetchall() hour1 = [n[0 ] for n in result] print hour1 num1 = [n[1 ] for n in result] print num1 N = 23 ind = np.arange(N) width=0.35 plt.bar(ind, num1, width, color='r' , label= 'sum num' ) plt.xticks(ind+width/2 , hour1, rotation= 40 ) for i in range( 23 ): plt.text(i, num1[i], str(num1[i]), ha='center' , va= 'bottom' , rotation= 45 ) plt.title('Number-24Hour' ) plt.xlabel('hours' ) plt.ylabel('The number of blog' ) plt.legend() plt.savefig('08csdn.png' ,dpi= 400 ) plt.show() except MySQLdb.Error,e: print "Mysql Error %d: %s" % (e.args[ 0 ], e.args[ 1 ]) finally : cur.close() conn.commit() conn.close()
运行结果如下图所示,突然发现我10点钟没有写过博客,哈哈!所以参数np.arange(23)设置成23,从图中看出午夜写博客很平凡。
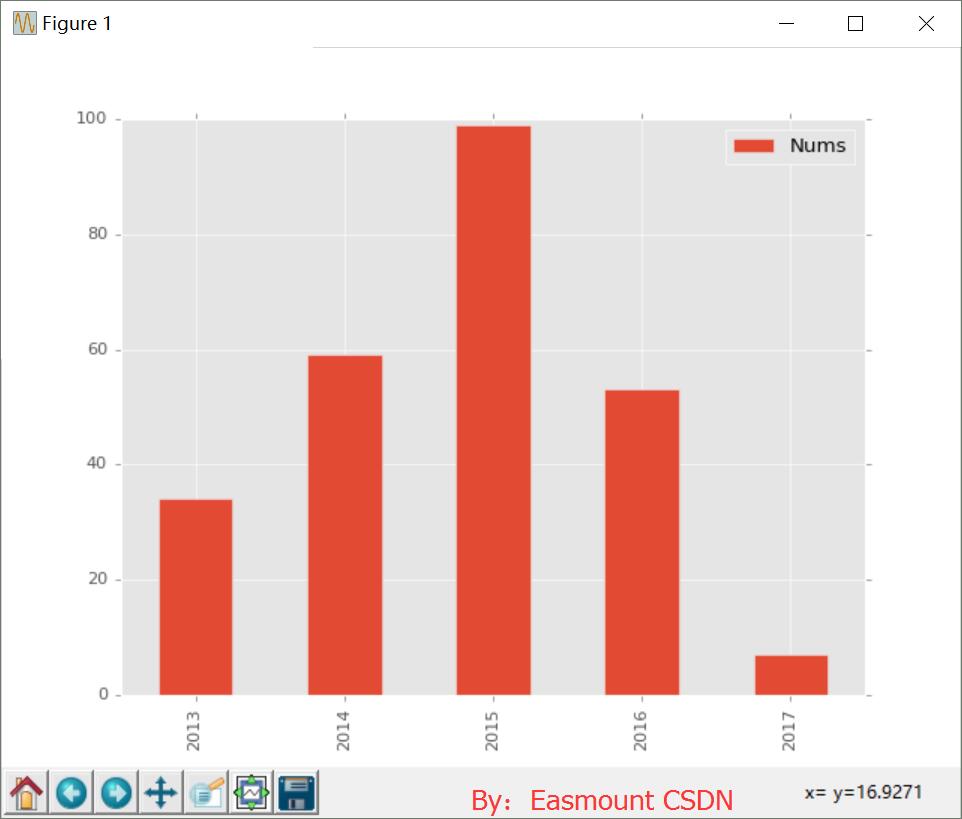
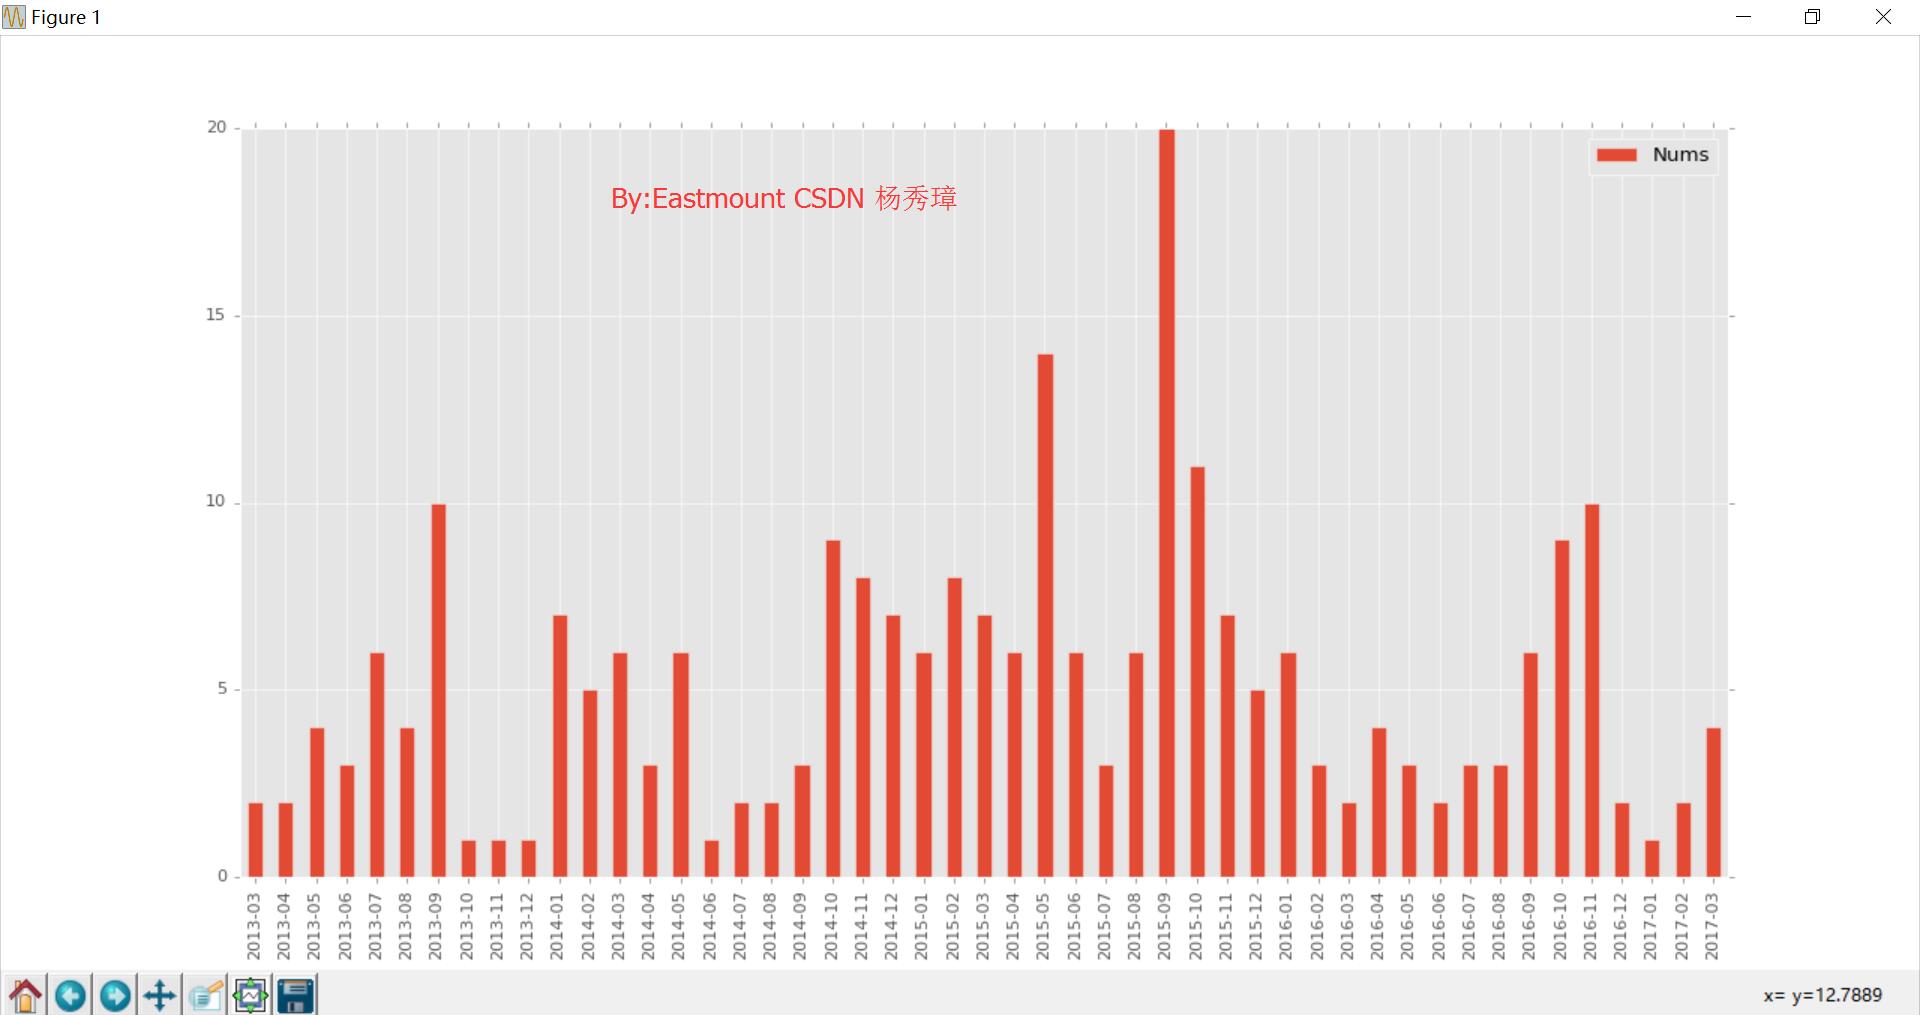
3.每年每月博客对比 SQL语句如下:
select DATE_FORMAT(FBTime,'%Y%m') as 年份, count(*) as 数量
分析博主从2013年开始,每个月份写博客的数量:
代码如下所示:
'' import matplotlib.pyplot as plt import matplotlib import pandas as pd import numpy as np import pylab import MySQLdb from pylab import * import matplotlib.pyplot as plt try : conn = MySQLdb.connect(host='localhost' ,user= 'root' , passwd='123456' ,port= 3306 , db= 'test01' ) cur = conn.cursor() conn.set_character_set('utf8' ) cur.execute('SET NAMES utf8;' ) cur.execute('SET CHARACTER SET utf8;' ) cur.execute('SET character_set_connection=utf8;' ) sql = '' cur.execute(sql) result = cur.fetchall() date1 = [n[0 ] for n in result] print date1 num1 = [n[1 ] for n in result] print num1 print type(date1) plt.scatter(date1,num1,25 ,color= 'white' ,marker= 'o' , edgecolors='#0D8ECF' ,linewidth= 3 ,alpha= 0.8 ) plt.title('Number-12Month' ) plt.xlabel('Time' ) plt.ylabel('The number of blog' ) plt.savefig('02csdn.png' ,dpi= 400 ) plt.show() except MySQLdb.Error,e: print "Mysql Error %d: %s" % (e.args[ 0 ], e.args[ 1 ]) finally : cur.close() conn.commit() conn.close()
运行结果如下图所示:
然后发现改图运行效果不好,下面进行改进。
4.通过DataFrame每年每月博客对比 SQL语句查询每年发表博客数据:select DATE_FORMAT(FBTime,'%Y'), Count(*) from csdn
核心代码如下所示:
'' import matplotlib.pyplot as plt import matplotlib import pandas as pd import numpy as np import pylab import MySQLdb from pylab import * from pandas import * try : conn = MySQLdb.connect(host='localhost' ,user= 'root' , passwd='123456' ,port= 3306 , db= 'test01' ) cur = conn.cursor() conn.set_character_set('utf8' ) cur.execute('SET NAMES utf8;' ) cur.execute('SET CHARACTER SET utf8;' ) cur.execute('SET character_set_connection=utf8;' ) sql = '' cur.execute(sql) result = cur.fetchall() day1 = [n[0 ] for n in result] print len(day1) num1 = [n[1 ] for n in result] print len(num1),type(num1) matplotlib.style.use('ggplot' ) df=DataFrame(num1, index=day1,columns=['Nums' ]) plt.show(df.plot(kind='bar' )) plt.savefig('05csdn.png' ,dpi= 400 ) except MySQLdb.Error,e: print "Mysql Error %d: %s" % (e.args[ 0 ], e.args[ 1 ]) finally : cur.close() conn.commit() conn.close()
运行结果如下图所示,同时设置SQL语句"%Y-%m-%d"可以设置年月日。
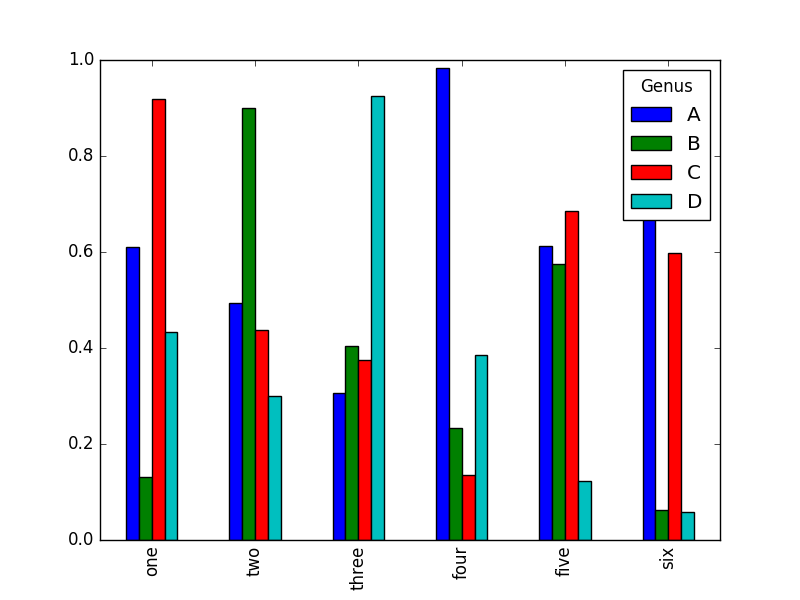
df=DataFrame(np.random.rand(6,4),index=['one','two','three','four','five','six'], columns=['A','B','C','D']) df.columns.name='Genus' 参考文章: http://www.cnblogs.com/splended/p/5229699.html
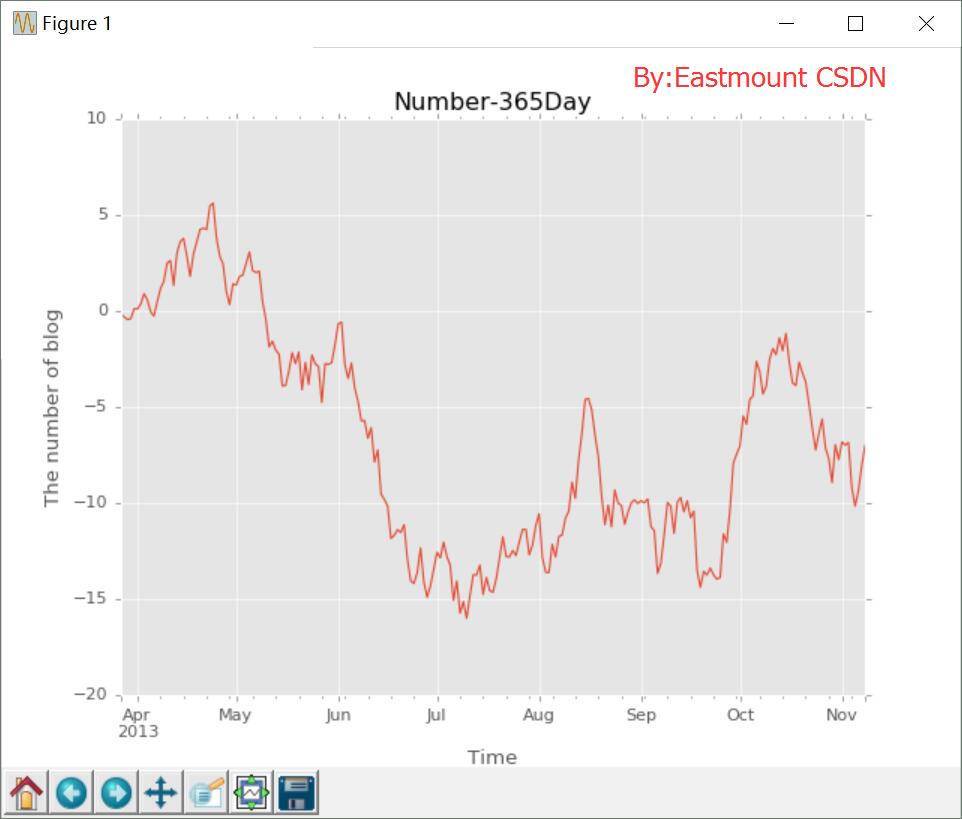
5.时间序列图 核心代码如下所示:
'' import matplotlib.pyplot as plt import matplotlib import pandas as pd import numpy as np import pylab import MySQLdb from pylab import * try : conn = MySQLdb.connect(host='localhost' ,user= 'root' , passwd='123456' ,port= 3306 , db= 'test01' ) cur = conn.cursor() conn.set_character_set('utf8' ) cur.execute('SET NAMES utf8;' ) cur.execute('SET CHARACTER SET utf8;' ) cur.execute('SET character_set_connection=utf8;' ) sql = '' cur.execute(sql) result = cur.fetchall() day1 = [n[0 ] for n in result] print len(day1) num1 = [n[1 ] for n in result] print len(num1),type(num1) matplotlib.style.use('ggplot' ) start = min(day1) print start ts = pd.Series(np.random.randn(len(num1)), index=pd.date_range(start, periods=len(num1))) ts = ts.cumsum() ts.plot() plt.title('Number-365Day' ) plt.xlabel('Time' ) plt.ylabel('The number of blog' ) plt.savefig('04csdn.png' ,dpi= 400 ) plt.show() except MySQLdb.Error,e: print "Mysql Error %d: %s" % (e.args[ 0 ], e.args[ 1 ]) finally : cur.close() conn.commit() conn.close()
运行结果如下所示:
同时如何设置具体的博客数量呢?设置num1参数总数递增的曲线,更多知识明天上班来解决及学习啦。
最后 希望这篇文章对你有所帮助,尤其是我的学生和接触数据挖掘、数据分析 的博友。这篇文字主要是记录一些代码片段,作为在线笔记,也希望对你有所帮助。 (By:Eastmount 2017-03-17 半夜12点 http://blog.csdn.net/eastmount/ )


 1万+
1万+

 被折叠的 条评论
为什么被折叠?
被折叠的 条评论
为什么被折叠?
 到【灌水乐园】发言


