


一. Wikepedia上有关IOPS 的说明
链接如下:http://en.wikipedia.org/wiki/IOPS
IOPS (Input/Output OperationsPer Second, pronounced i-ops) is a common performance measurement used to benchmark computer storage devices like harddisk drives (HDD), solid state drives (SSD), and storage area networks (SAN). As with anybenchmark, IOPS numbers published by storage device manufacturers do notguarantee real-world application performance.
IOPS can bemeasured with applications such as Iometer (originallydeveloped by Intel),as well as IOzone and FIO[3] and isprimarily used with servers to find the best storageconfiguration.
The specificnumber of IOPS possible in any system configuration will vary greatly dependingupon the variables the tester enters into the program, including the balance ofread and write operations, the mix of sequential and random accesspatterns, the number of worker threads and queue depth, as well asthe data block sizes.[1] Thereare other factors which can also affect the IOPS results including the systemsetup, storage drivers, OS background operations, etc. Also, when testing SSDsin particular, there are preconditioning considerations that must be taken intoaccount.[4]
1.1 Performance characteristics
The most commonperformance characteristics measured are sequential and random operations.
Random access compared tosequential access:
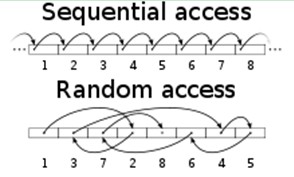
Sequential operations access locations on the storage device in a contiguous manner and are generally associated withlarge data transfer sizes, e.g., 128 KB.
Random operations access locations on the storage device in a non-contiguous mannerand are generally associated with small data transfer sizes, e.g., 4 KB.
The most commonperformance characteristics are as follows:
| Measurement | Description |
| Total IOPS | Total number of I/O operations per second (when performing a mix of read and write tests) |
| Random Read IOPS | Average number of random read I/O operations per second |
| Random Write IOPS | Average number of random write I/O operations per second |
| Sequential Read IOPS | Average number of sequential read I/O operations per second |
| Sequential Write IOPS | Average number of sequential write I/O operations per second |
For HDDs and similar electromechanical storage devices, the random IOPS numbers are primarily dependent upon the storagedevice's random seek time, whereas for SSDs and similar solid statestorage devices, the random IOPS numbers are primarily dependent upon thestorage device's internal controller and memory interface speeds.
On both types ofstorage devices the sequential IOPS numbers (especially when using a largeblock size) typically indicate the maximum sustained bandwidth that the storagedevice can handle.[1]
Often sequential IOPS arereported as a simple MB/s number asfollows:
IOPS * TransferSizeInBytes = BytesPerSec (withthe answer typically converted to MegabytesPerSec)
Some HDDs willimprove in performance as the number of outstanding IO's (i.e. queue depth)increases. This is usually the result of more advanced controller logic on thedrive performing command queuing and reordering commonly called either Tagged Command Queuing (TCQ) or Native Command Queuing (NCQ).
Mostcommodity SATA driveseither cannot do this, or their implementation is so poor that no performancebenefit can be seen. Enterprise class SATA drives, such as the Western Digital Raptor and SeagateBarracuda NL will improve by nearly 100% with deep queues.[5] High-end SCSI drives morecommonly found in servers, generally show much greater improvement, withthe Seagate Savvio exceeding 400 IOPS—more thandoubling its performance.[citation needed]
While traditional HDDs have about the same IOPS for read and write operations,most NAND flash-based SSDs are much slower writingthan reading due to the inability to rewrite directly into a previously writtenlocation forcing a procedure called garbage collection.[6][7][8] This hascaused hardware test sites to start to do IOPS testing, providing independentlymeasured results.
Newerflash SSD drives such as the Intel X25-E have much higher IOPS than traditionalhard disk drives. In a test done by Xssist, using IOmeter, 4 KB randomtransfers, 70/30 read/write ratio, queue depth 4, the IOPS delivered by theIntel X25-E 64 GB G1 started around 10000 IOPs, and dropped sharply after8 minutes to 4000 IOPS, and continued to decrease gradually for the next 42minutes. IOPS vary between 3000 to 4000 from around the 50th minutes onwardsfor the rest of the 8+ hours test run.[9] Even with thedrop in random IOPS after the 50th minute, the X25-E still has much higher IOPScompared to traditional hard disk drives. Some SSDs, including the OCZ RevoDrive 3 x2PCIe using the SandForce controller, have shown much higher sustainedwrite performance that more closely matches the read speed.[10]
1.2 示例
| Device | Type | IOPS | Interface | Notes |
| ~75-100 IOPS[2] | SATA 3 Gb/s | |||
| 10,000 rpm SATA drives | HDD | ~125-150 IOPS[2] | SATA 3 Gb/s | |
| 15,000 rpm SAS drives | HDD | ~175-210 IOPS [2] | SAS |
二. IOPS 说明
2.1 IOPS (Input/Output Per Second)
IOPS 即每秒的输入输出量(或读写次数),是衡量磁盘性能的主要指标之一。IOPS是指单位时间内系统能处理的I/O请求数量,一般以每秒处理的I/O请求数量为单位,I/O请求通常为读或写数据操作请求。例如,主机写入一个最小的数据块,也要经过“发送写入请求、写入数据、收到写入确认”等三个步骤,也就是3个存储端访问。
随机读写频繁的应用,如OLTP(OnlineTransaction Processing),IOPS是关键衡量指标。
另一个重要指标是数据吞吐量(Throughput),指单位时间内可以成功传输的数据数量。对于大量顺序读写的应用,如VOD(Video On Demand),则更关注吞吐量指标。
传统磁盘本质上一种机械装置,如FC, SAS, SATA磁盘,转速通常为5400/7200/10K/15K rpm不等。影响磁盘的关键因素是磁盘服务时间,即磁盘完成一个I/O请求所花费的时间,它由寻道时间、旋转延迟和数据传输时间三部分构成。
(1)寻道时间
Tseek是指将读写磁头移动至正确的磁道上所需要的时间。寻道时间越短,I/O操作越快,目前磁盘的平均寻道时间一般在3-15ms。
(2)旋转延迟
Trotation是指盘片旋转将请求数据所在扇区移至读写磁头下方所需要的时间。旋转延迟取决于磁盘转速,通常使用磁盘旋转一周所需时间的1/2表示。比如,7200 rpm的磁盘平均旋转延迟大约为60*1000/7200/2 = 4.17ms,而转速为15000 rpm的磁盘其平均旋转延迟约为2ms。
(3)数据传输时间
Ttransfer是指完成传输所请求的数据所需要的时间,它取决于数据传输率,其值等于数据大小除以数据传输率。目前IDE/ATA能达到133MB/s(MBPS),SATA II可达到300MB/s的接口数据传输率,数据传输时间通常远小于前两部分时间。
IOPS(每秒IO次数) = 1s/(寻道时间+旋转延迟+数据传输时间)
因此,理论上可以计算出磁盘的最大IOPS,即IOPS = 1000ms/ (Tseek + Troatation),忽略数据传输时间。假设磁盘平均物理寻道时间为3ms, 磁盘转速为7200,10K,15Krpm,则磁盘IOPS理论最大值分别为:
IOPS = 1000 / (3 + 60000/7200/2) = 140
IOPS = 1000 / (3 + 60000/10000/2) = 167
IOPS = 1000 / (3 + 60000/15000/2) = 200
下面列一下不同的硬盘所能支撑的流量大小:
IOPS的主要取决与阵列的算法,cache命中率,以及磁盘个数。我们假定一个case,业务的iops是10000,读cache命中率是30%,读iops为60%,写iops为40%,磁盘个数为120,那么分别计算在raid5与raid10的情况下,每个磁盘的iops为多少。
2.2 固态硬盘的IOPS
固态硬盘SSD是一种电子装置, 避免了传统磁盘在寻道和旋转上的时间花费,存储单元寻址开销大大降低,因此IOPS可以非常高,能够达到数万甚至数十万。实际测量中,IOPS数值会受到很多因素的影响,包括I/O负载特征(读写比例,顺序和随机,工作线程数,队列深度,数据记录大小)、系统配置、操作系统、磁盘驱动等等。因此对比测量磁盘IOPS时,必须在同样的测试基准下进行,即便如何也会产生一定的随机不确定性。
通常情况下,IOPS可细分为如下几个指标:
Toatal IOPS:混合读写和顺序随机I/O负载情况下的磁盘IOPS,这个与实际I/O情况最为相符,大多数应用关注此指标。
Random Read IOPS:100%随机读负载情况下的IOPS。
Random WriteIOPS:100%随机写负载情况下的IOPS。
Sequential ReadIOPS:100%顺序负载读情况下的IOPS。
Sequential WriteIOPS:100%顺序写负载情况下的IOPS。
三.ORION 工具说明
ORION (OracleI/O Calibration Tool) Oracle 公司推出的一个校准数据库的存储系统 I/O 性能的独立工具。有关该工具的说明,参考:
http://blog.csdn.net/tianlesoftware/article/details/5965331
我们使用ORION 工具测试一下看看:
[root@qs-xe-dzora-pd software]# cat dave.lun
/dev/sdb1
[root@qs-xe-dzora-pd software]# ./orion_linux_x86-64 -run advanced -testname dave -num_disks 2
ORION: ORacle IO Numbers -- Version11.1.0.7.0
dave_20111026_2026
Test will take approximately 16 minutes
Larger caches may take longer
查看生成的结果:
[root@qs-xe-dzora-pd software]# ls dave*
dave_20111026_2026_iops.csv dave_20111026_2026_summary.txt dave.lun_20111026_2025_summary.txt
dave_20111026_2026_lat.csv dave_20111026_2026_trace.txt
dave_20111026_2026_mbps.csv dave.lun
[root@qs-xe-dzora-pd software]# cat dave_20111026_2026_summary.txt
ORION VERSION 11.1.0.7.0
Commandline:
-run advanced -testname dave -num_disks 2
This maps to this test:
Test: dave
Small IO size: 8 KB
Large IO size: 1024 KB
IO Types: Small Random IOs, Large RandomIOs
Simulated Array Type: CONCAT
Write: 0%
Cache Size: Not Entered
Duration for each Data Point: 60 seconds
Small Columns:, 0
Large Columns:, 0, 1, 2, 3, 4
Total Data Points: 15
Name: /dev/sdb1 Size: 449495069184
1 FILEs found.
Maximum Large MBPS=159.61 @ Small=0 andLarge=4
Maximum Small IOPS=534 @ Small=10 andLarge=0
Minimum Small Latency=4.97 @ Small=1 andLarge=0
这里显示的吞吐量是160MBPS. IOPS 为534.


 10万+
10万+


 被折叠的 条评论
为什么被折叠?
被折叠的 条评论
为什么被折叠?
 到【灌水乐园】发言


