


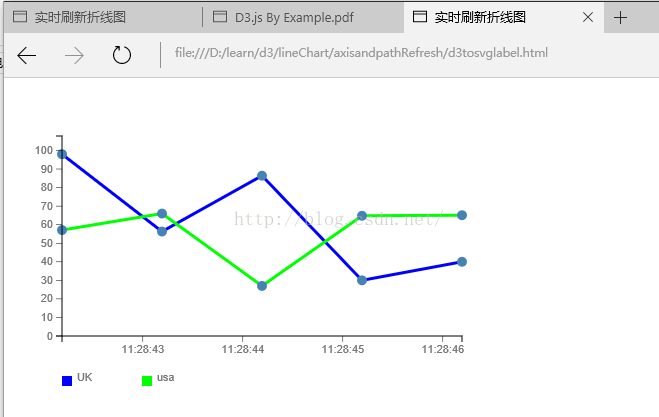
接上篇的的刷新折线图的样例,增加了信息点的显示以及坐标轴的更新。坐标轴的时间更新的应用可用于做历史曲线等曲线图。在这里碰到的问题是
在mircrosoft Edge下运行完美。但是在chrome下出现刻度线缺失情况。百思不得其解。先上运行结果图:
html文件
<html>
  <head>
        <meta charset="utf-8">
        <title>实时刷新折线图</title>
		<link rel="stylesheet" type="text/css" href="d3LineChart.css">
		<script src="jquery-1.10.2.min.js" type="text/javascript"></script>
		<script src="jquery.tipsy.js" type="text/javascript"></script>
		<link href="tipsy.css" rel="stylesheet" type="text/css" />
  <style>
	.axis path,
	.axis line{
		fill: none;
		stroke: black;
		shape-rendering: crispEdges;
	}

	.axis text {
		font-family: sans-serif;
		font-size: 11px;
	}

	.overlay {
		fill: none;
		pointer-events: all;
	}

	.tooltip{
		width: 150px;
		height: auto;
		position: absolute;
		font-family: simsun;
		font-size: 16px;
		line-height: 26px;
		text-align: left;
		border: 1px solid black;
		background-color: white;
		border-radius: 5px;
    }

    .tooltip .title{
    	border-bottom: 1px solid #000;
    	text-align: center;
    }

    .tooltip .desColor{
    	width: 10px;
    	height: 10px;
    	float: left;
		margin: 9px 8px 1px 8px;
    }

    .tooltip .desText{
    	display: inline;
    }

    .focusLine {
		stroke: black;
		stroke-width: 1px;
		stroke-dasharray: 5,5;
	}
  </style>
  </head>
<body>

<script src="http://d3js.org/d3.v3.js" charset="utf-8"></script>
<script src="linechart.js" charset="utf-8"></script>
<svg id="fillgauge1" contentScriptType="text/ecmascript" width="500" xmlns:xlink="http://www.w3.org/1999/xlink" zoomAndPan="magnify" style="background-color:#ffffff;" contentStyleType="text/css" viewBox="0 0 500.0 300.0" height="300" preserveAspectRatio="xMidYMid meet" xmlns="http://www.w3.org/2000/svg" version="1.0">
</svg>
<script>
var t=new Date();
var timenow=t.getTime();
var dataset = [
	{
		country: "UK",
		gdp: [[timenow-4000,NewValue()],[timenow-3000,NewValue()],[timenow-2000,NewValue()],
			[timenow-1000,NewValue()],[timenow,NewValue()]]
	},
	{
		country: "usa",
		gdp: [[timenow-4000,NewValue()],[timenow-3000,NewValue()],[timenow-2000,NewValue()],
				[timenow-1000,NewValue()],[timenow,NewValue()]]
	}
];

var gauge1=loadLineChart("fillgauge1",dataset);
 function NewValue(){
        if(Math.random() > .5){
            return Math.round(Math.random()*100);
        } else {
            return (Math.random()*100).toFixed(1);
        }
    }

function refreshLine(gauge1){
    var nowDate=new Date();
    var refreshtimenow=nowDate.getTime();

	var updateData =[
	{
		country: "china",
		gdp: [[refreshtimenow-4000,NewValue()],[refreshtimenow-3000,NewValue()],[refreshtimenow-2000,NewValue()],
			[refreshtimenow-1000,NewValue()],[refreshtimenow,NewValue()]]
	},
	{
		country: "usa",
		gdp: [[refreshtimenow-4000,NewValue()],[refreshtimenow-3000,NewValue()],[refreshtimenow-2000,NewValue()],
				[refreshtimenow-1000,NewValue()],[refreshtimenow,NewValue()]]
	}
    ];

	gauge1.update(updateData);
	}

self.setInterval("refreshLine(gauge1)",4000);
</script>

</body>
</html>
用于刷新和载入的js文件
function loadLineChart(elementId, dataset) {

	var svg = d3.select("#" + elementId);

	var strs = svg.attr("viewBox").split(" ");
	var width = strs[2];
	var height = strs[3];

	//外边框
	var padding = {
		top : 50,
		right : 50,
		bottom : 50,
		left : 50
	};

	var names = new Array();
	//计算GDP的最大值
	var gdpmax = 0;

	for (var i = 0; i < dataset.length; i++) {
		var currGdp = d3.max(dataset[i].gdp, function (d) {
				return d[1];
			});
		if (currGdp > gdpmax)
			gdpmax = currGdp;

	}
	//计算时间戳的最大值
	var timemax = 0;
	var timemin = 0;
	for (var i = 0; i < dataset.length; i++) {
		var currMaxTime = d3.max(dataset[i].gdp, function (d) {
				return d[0];
			});

		var currMinTime = d3.min(dataset[i].gdp, function (d) {
				return d[0];
			});
		if (currMaxTime > timemax) {
			timemax = currMaxTime;
		}

		timemin = currMinTime;
	}

	var xScale = d3.time.scale()
		.domain([new Date(timemin), new Date(timemax)])
		.range([0, width - padding.left - padding.right]);

	var yScale = d3.scale.linear()
		.domain([0, gdpmax * 1.1])
		.range([height - padding.top - padding.bottom, 0]);

	//创建一个直线生成器
	var linePath = d3.svg.line()
		.x(function (d) {
			return xScale(d[0]);
		})
		.y(function (d) {
			return yScale(d[1]);
		})
		//.interpolate("basis");

	//定义两个颜色
	var colors = [d3.rgb(0, 0, 255), d3.rgb(0, 255, 0)];

	//添加路径
	svg.selectAll("path") //选择<svg>中所有的<path>
	.data(dataset) //绑定数据
	.enter() //选择enter部分
	.append("path") //添加足够数量的<path>元素
	.attr("transform", "translate(" + padding.left + "," + padding.top + ")")
	.attr("d", function (d) {

		return linePath(d.gdp); //返回直线生成器得到的路径
	})
	.attr("fill", "none")
	.attr("stroke-width", 3)
	.attr("stroke", function (d, i) {
		return colors[i];
	});

	var dataCirclesGroup = null;

	dataCirclesGroup = svg.append('svg:g');
	dataCirclesGroup.attr("transform", "translate(" + padding.left + "," + padding.top + ")");

	var chinaData = dataset[1].gdp.concat(dataset[0].gdp);

	dataCirclesGroup.selectAll('circle')
	.data(chinaData)
	.enter()
	.append('svg:circle')
	.attr('class', 'data-point')

	.attr('cx', function (d) {
		return xScale(
			d[0]);
	})
	.attr('cy', function (d) {
		return yScale(
			d[1]);
	})

	.attr('r', 4);

	//规定提示框中时间的格式
	function formatDate(now) {

		var hour = now.getHours();
		var minute = now.getMinutes();
		var second = now.getSeconds();
		var minsecond = now.getMilliseconds();
		return hour + ":" + minute + ":" + second + ":" + minsecond;
	}

	$('svg circle').tipsy({
		gravity : 'w',
		html : true,
		title : function () {
			var d = this.__data__;
			var pDate = new Date(d[0]);
			return 'Date: ' + formatDate(pDate) + '<br>Value: ' + d[1];
		}
	});

	var markStep = 80;

	var gMark = svg.selectAll(".gMark")
		.data(dataset)
		.enter()
		.append("g")
		.attr("transform", function (d, i) {
			return "translate(" + (padding.left + i * markStep) + "," + (height - padding.bottom + 40) + ")";
		});

	gMark.append("rect")
	.attr("x", 0)
	.attr("y", 0)
	.attr("width", 10)
	.attr("height", 10)
	.attr("fill", function (d, i) {
		return colors[i];
	});

	gMark.append("text")
	.attr("dx", 15)
	.attr("dy", ".5em")
	.attr("fill", "black")
	.text(function (d) {
		return d.country;
	});

	//x轴,刻度线转换为时分秒
	var xAxis = d3.svg.axis()
		.scale(xScale)
		.ticks(5)
		.tickFormat(d3.time.format("%H:%M:%S"))
		//.tickSize(10)
		.orient("bottom");

	//y轴
	var yAxis = d3.svg.axis()
		.scale(yScale)
		.orient("left");

	svg.append("g")
	.attr("class", "axis")
	.attr("transform", "translate(" + padding.left + "," + (height - padding.bottom) + ")")
	.call(xAxis);

	svg.append("g")
	.attr("class", "y axis")
	.attr("transform", "translate(" + padding.left + "," + padding.top + ")")
	.call(yAxis);

	function updateLineChart() {

	    //更新折线图
		this.update = function (updateData) {
			var timemax = 0;
			var timemin = 0;
			var chData = updateData[1].gdp.concat(updateData[0].gdp);
			for (var i = 0; i < updateData.length; i++) {
				var currMaxTime = d3.max(updateData[i].gdp, function (d) {
						return d[0];
					});

				var currMinTime = d3.min(updateData[i].gdp, function (d) {
						return d[0];
					});
				if (currMaxTime > timemax) {
					timemax = currMaxTime;
				}

				timemin = currMinTime;
			}

			xScale = d3.time.scale()
				.domain([new Date(timemin), new Date(timemax)])
				.range([0, width - padding.left - padding.right]);
			xAxis = d3.svg.axis()
				.scale(xScale)
				.ticks(5)
				.tickFormat(d3.time.format("%H:%M:%S"))
				.orient("bottom");
			svg.selectAll("g.axis")
			.call(xAxis);

			var numValues = updateData.length;
			var updategdpmax = 0;
			for (var i = 0; i < updateData.length; i++) {
				var currGdp = d3.max(updateData[i].gdp, function (d) {
						return d[1];
					});
				if (currGdp > updategdpmax)
					updategdpmax = currGdp;
			}

			yScale = d3.scale.linear()
				.domain([0, updategdpmax * 1.1])
				.range([height - padding.top - padding.bottom, 0]);
			yAxis = d3.svg.axis()
				.scale(yScale)
				.orient("left");
			svg.selectAll("g.y.axis")
			.call(yAxis);

			svg.selectAll("path") //选择<svg>中所有的<path>
			.data(updateData) //绑定数据
			.transition()
			.duration(2000)
			.ease("linear")
			.attr("d", function (d) {

				return linePath(d.gdp); //返回直线生成器得到的路径
			});

			dataCirclesGroup.selectAll('circle')
			.data(chData)
			.transition()
			.duration(2000)
			.attr('cx', function (d) {
				return xScale(d[0])
			})
			.attr('cy', function (d) {
				return yScale(d[1])
			})
			.attr('r', 4);

		}

	}
	return new updateLineChart();
}
下面上在谷歌下的运行结果:
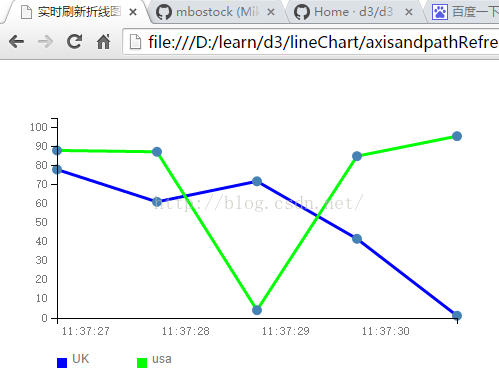
坐标轴成了这个熊样子了,求高手解答


 6210
6210


 被折叠的 条评论
为什么被折叠?
被折叠的 条评论
为什么被折叠?
 到【灌水乐园】发言


