


zabbix-server 10.6.12.22
zabbix-server 10.6.12.89
配置zabbix的yum源
rpm -Uvh https://repo.zabbix.com/zabbix/4.0/rhel/7/x86_64/zabbix-release-4.0-1.el7.noarch.rpm
yum clean all
安装zabbix程序包,安装zabbxi-agent 可能要装几次偶尔会失败
yum -y install zabbix-agent

临时关闭selinux
setenforce 0
永久关闭selinux 需要重启生效
修改/etc/sysconfig/selinux 将enforcing改成disabled

修改/etc/zabbix/zabbix_agentd.conf 为下面内容
| PidFile=/var/run/zabbix/zabbix_agentd.pid LogFile=/var/log/zabbix/zabbix_agentd.log LogFileSize=0
Server=10.6.12.22 ServerActive=10.6.12.22 Hostname=scrpit-test UnsafeUserParameters=1
UserParameter=discovery.process,/opt/zabbix/scripts/discovery_process.sh UserParameter=process.check[*],/opt/zabbix/scripts/process_check.sh $1 $2 $3 |
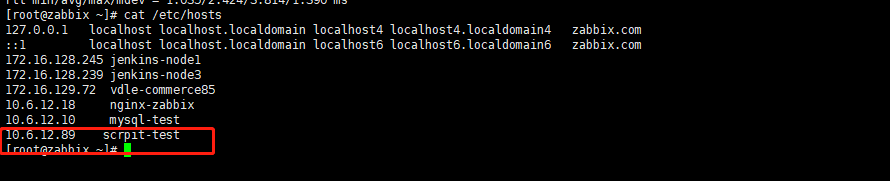
在zabbix主机10.6.12.22的/etc/hosts中添加10.6.12.89
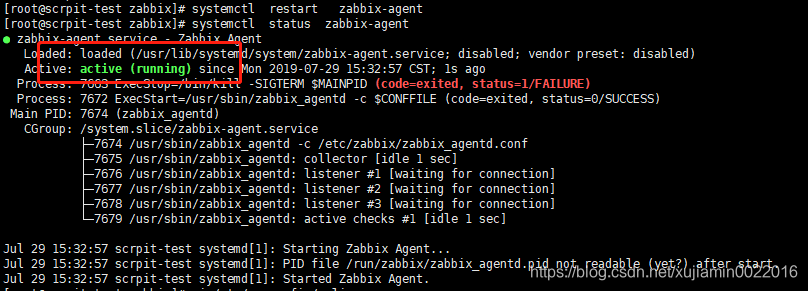
在10.6.12.89上启动zabbix-agent
systemctl stop firewalld
systemctl restart zabbix-agent
systemctl status zabbix-agent
在10.6.12.22上 重启zabbix-server
systemctl restart zabbix-server
mkdir -p /opt/zabbix/scripts/
| cat >/opt/zabbix/scripts/discovery_process.sh <<EOF #!/bin/bash #system process discovery script #top -b -n 1 > /tmp/.top.txt 如果添加了这条 可以不需要添加定时任务 chown zabbix. /tmp/.top.txt proc_array=(`tail -n +8 /tmp/.top.txt | awk '{a[$NF]+=$10}END{for(k in a)print a[k],k}'|sort -gr|head -10|cut -d" " -f2`) length=${#proc_array[@]}
printf "{\n" printf '\t'"\"data\":[" for ((i=0;i<$length;i++)) do printf "\n\t\t{" printf "\"{#PROCESS_NAME}\":\"${proc_array[$i]}\"}" if [ $i -lt $[$length-1] ];then printf "," fi done printf "\n\t]\n" printf "}\n" EOF
|
| cat >/opt/zabbix/scripts/process_check.sh <<EOF #!/bin/bash #system process CPU&MEM use information mode=$1 name=$2 process=$3 mem_total=$(cat /proc/meminfo | grep "MemTotal" | awk '{printf "%.f",$2/1024}') cpu_total=$(( $(cat /proc/cpuinfo | grep "processor" | wc -l) * 100 ))
function mempre { mem_pre=`tail -n +8 /tmp/.top.txt | awk '{a[$NF]+=$10}END{for(k in a)print a[k],k}' | grep "\b${process}\b" | cut -d" " -f1` echo "$mem_pre" } #加\b 可以避免查mysql的时候mysql_safe的结果也被查出来 function memuse { mem_use=`tail -n +8 /tmp/.top.txt | awk '{a[$NF]+=$10}END{for(k in a)print a[k]/100*'''${mem_total}''',k}' | grep "\b${process}\b" | cut -d" " -f1` echo "$mem_use" | awk '{printf "%.f",$1*1024*1024}' }
function cpuuse { cpu_use=`tail -n +8 /tmp/.top.txt | awk '{a[$NF]+=$9}END{for(k in a)print a[k],k}' | grep "\b${process}\b" | cut -d" " -f1` echo "$cpu_use" }
function cpupre { cpu_pre=`tail -n +8 /tmp/.top.txt | awk '{a[$NF]+=$9}END{for(k in a)print a[k]/('''${cpu_total}'''),k}' | grep "\b${process}\b" | cut -d" " -f1` echo "$cpu_pre" }
case $name in mem) if [ "$mode" = "pre" ];then mempre elif [ "$mode" = "avg" ];then memuse fi ;; cpu) if [ "$mode" = "pre" ];then cpupre elif [ "$mode" = "avg" ];then cpuuse fi ;; *) echo -e "Usage: $0 [mode : pre|avg] [mem|cpu] [process]" esac EOF
|
在10.6.12.89上执行
chmod +x /opt/zabbix/scripts/*.sh
chown -R zabbix /tmp/.top.txt
否则会出现这样的问题
![]()
添加定时任务 每分钟生成一份/tmp/.top.txt
输入crontab -e
添加一行
*/1 * * * * /opt/zabbix/scripts/top.sh
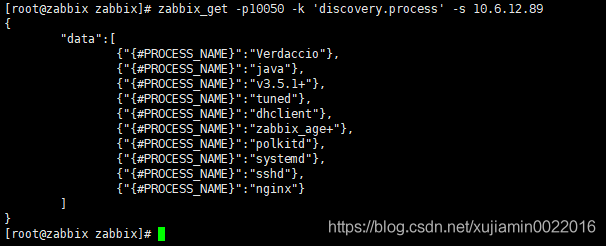
在10.6.12.22上执行
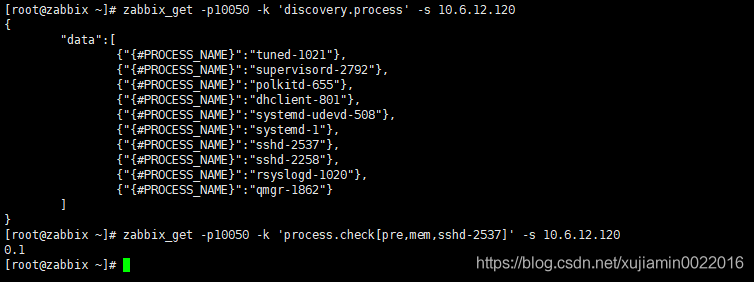
zabbix_get -p10050 -k 'discovery.process' -s 10.6.12.89
zabbix_get -p10050 -k 'process.check[pre,mem,Verdaccio]' -s 10.6.12.89

登录zabbix
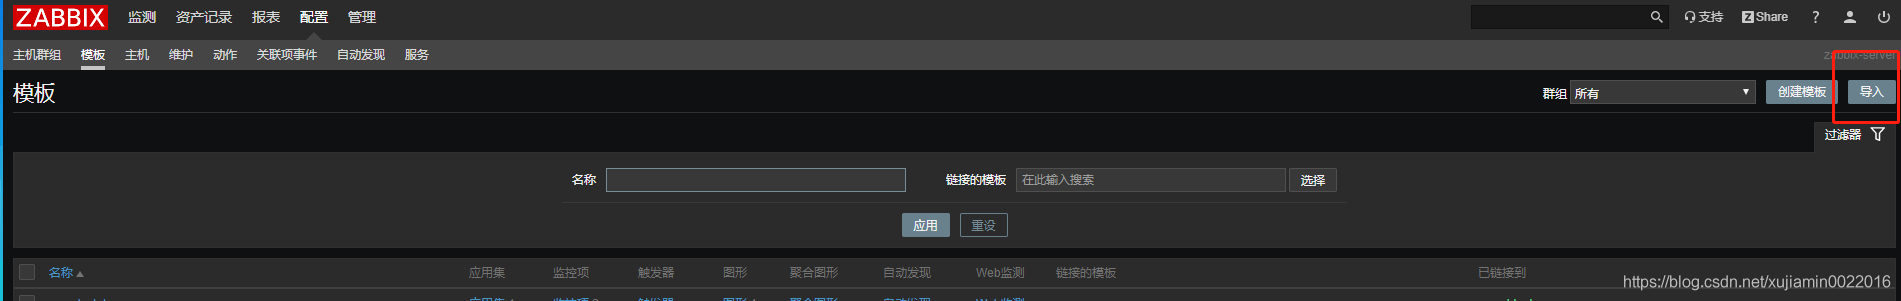
配置zabbix 模板
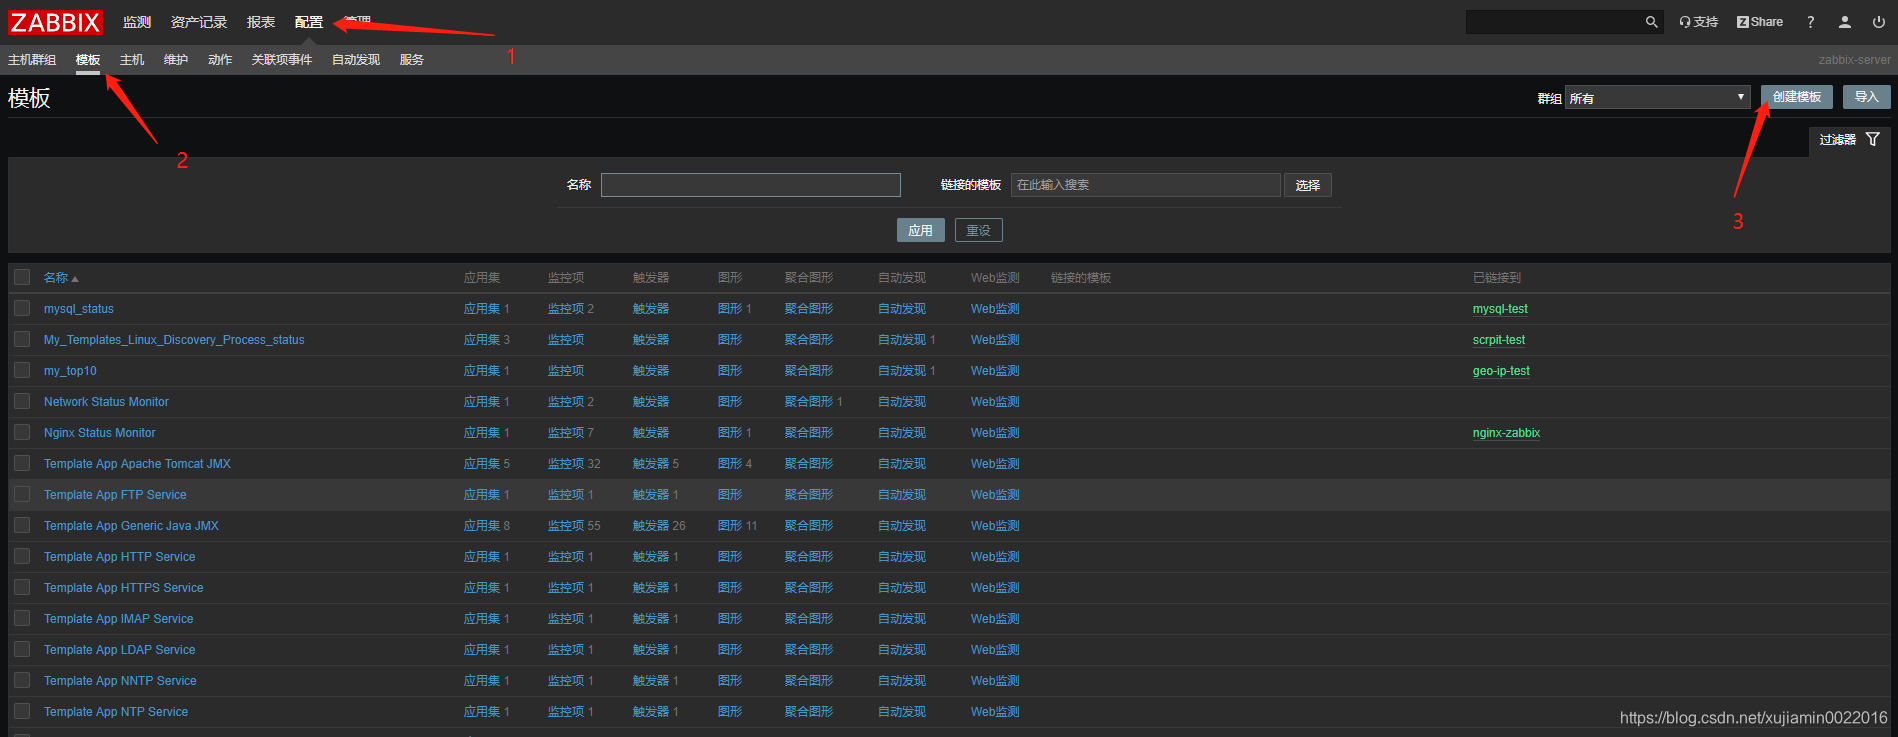
输入模板名称My_Templates_Linux_Discovery_Process_status 群组ESXI_87.141
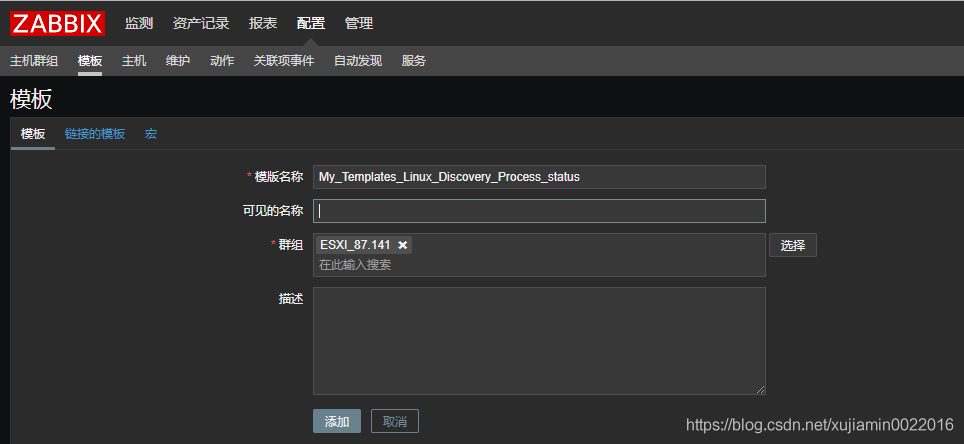
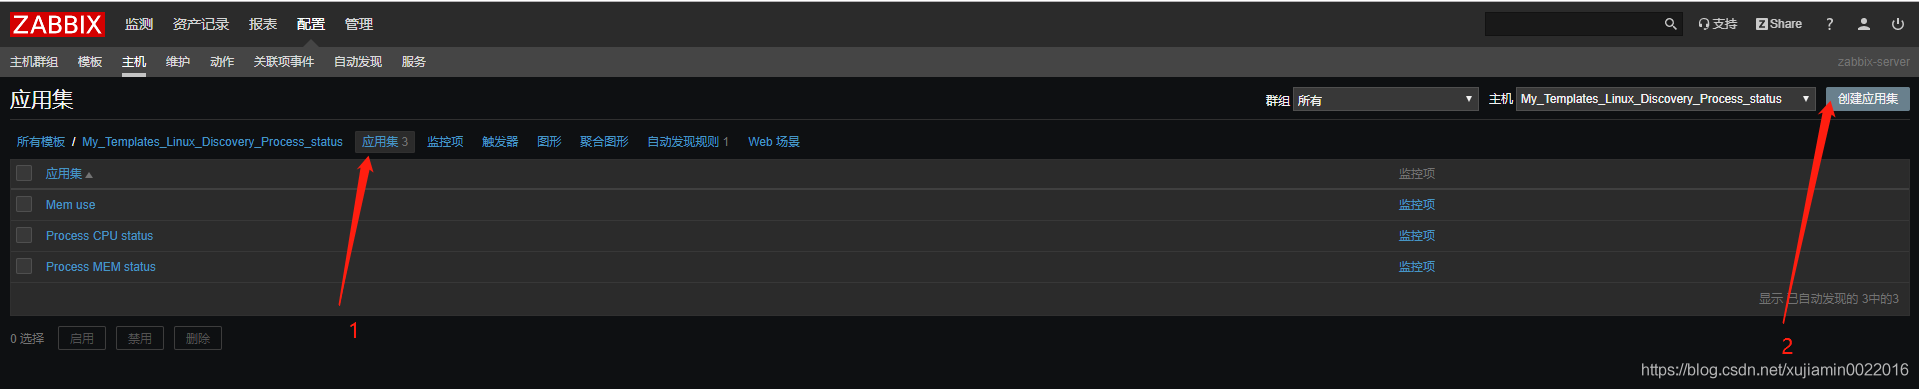
添加成功之后 点击进入模块 创建应用集
Mem use

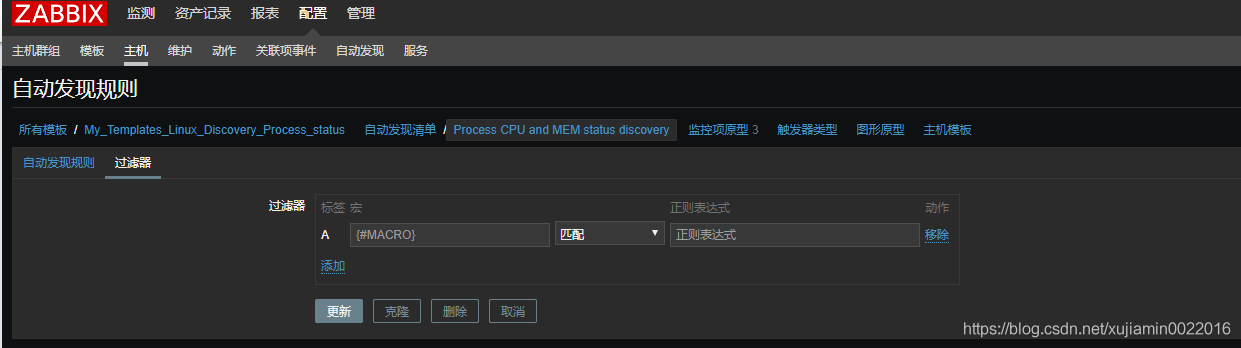
创建自动发现规则Process CPU and MEM status discovery
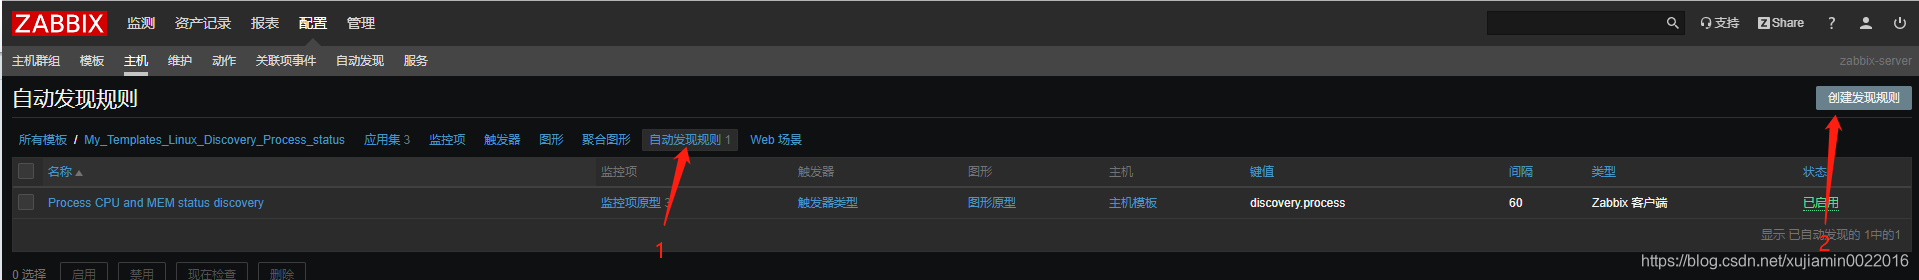
键值为discovery.process
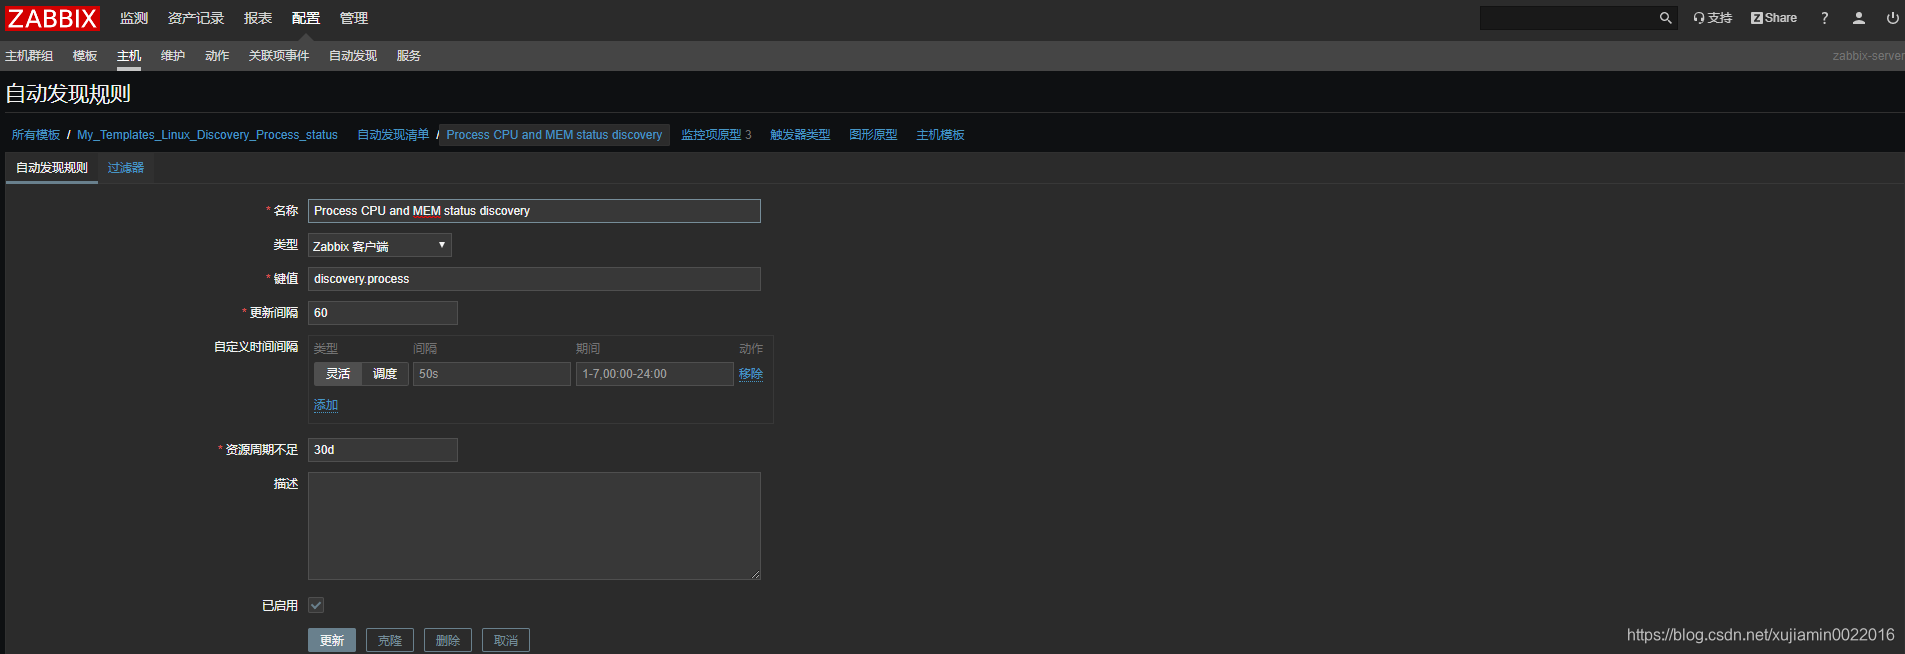
过滤器 不需要动
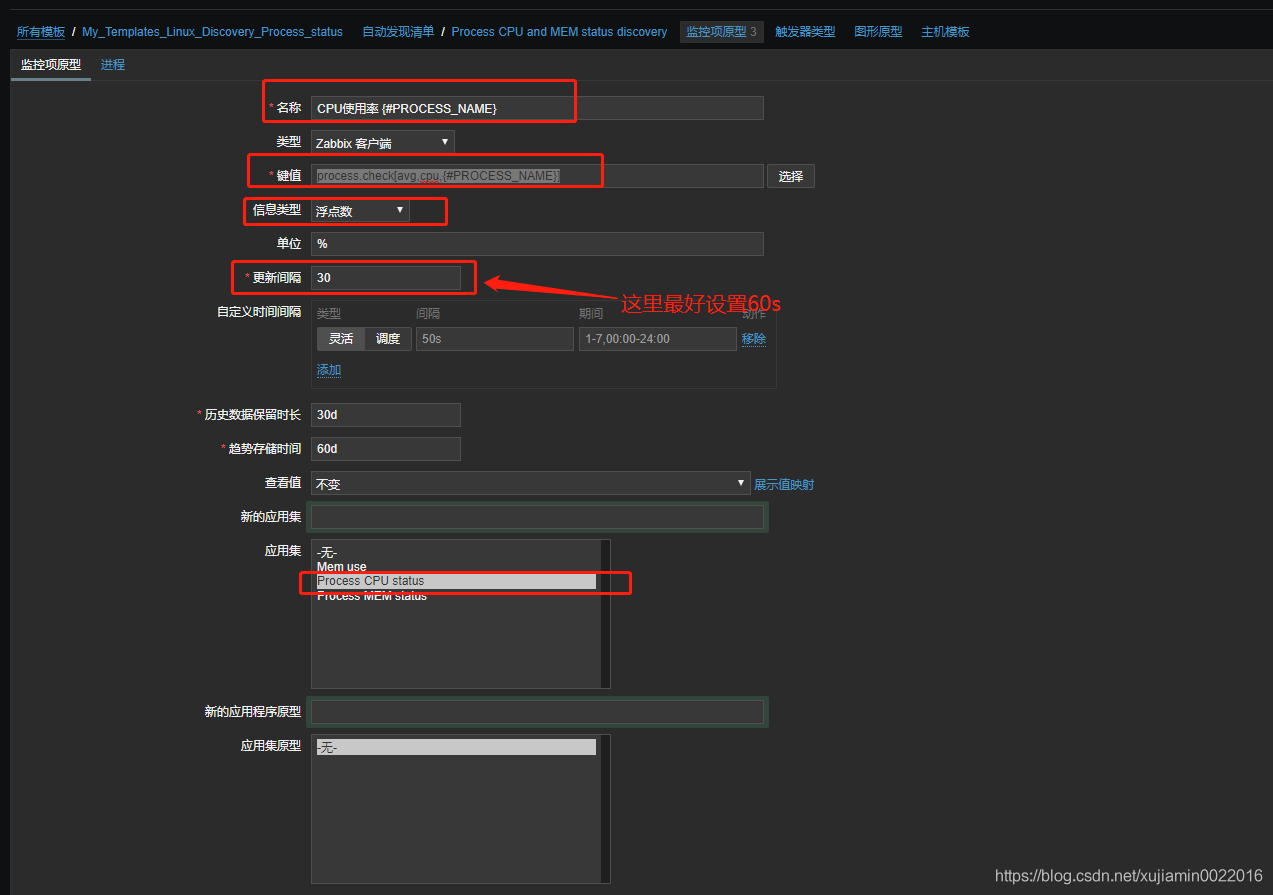
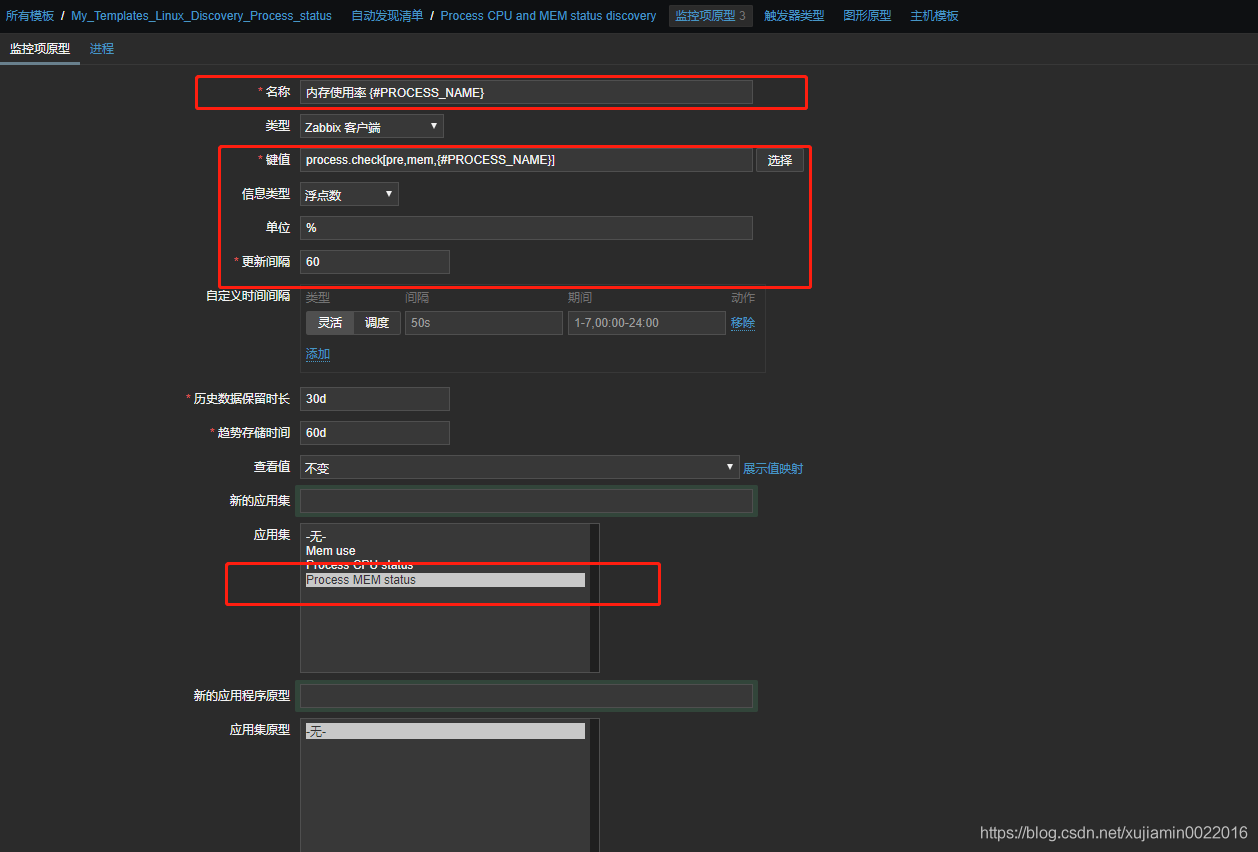
创建监控原型
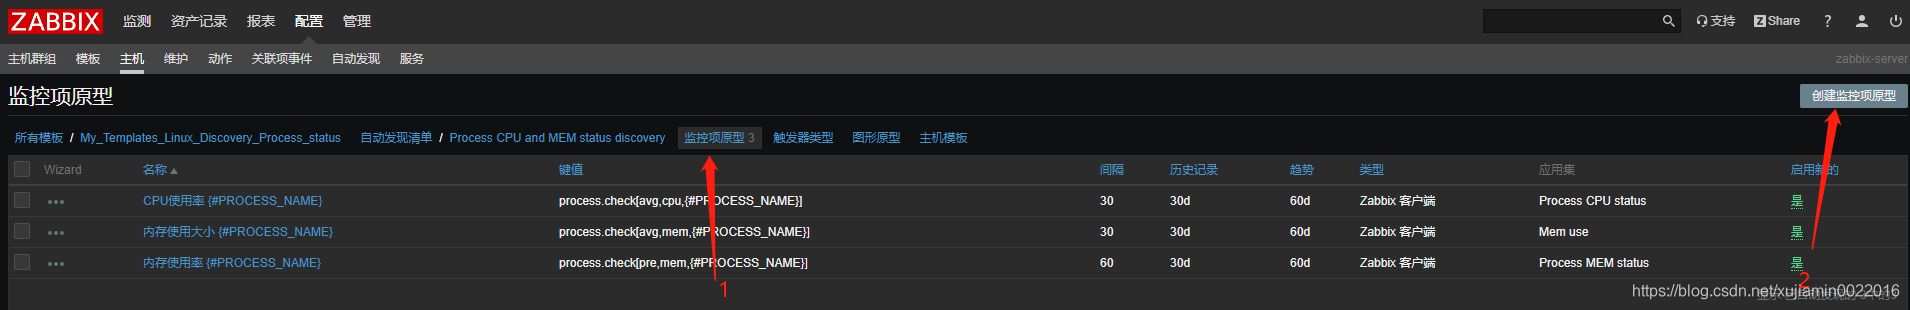 CPU使用率 {#PROCESS_NAME}
键值 process.check[avg,cpu,{#PROCESS_NAME}]
红框是需要修改的内容 进程不需要修改
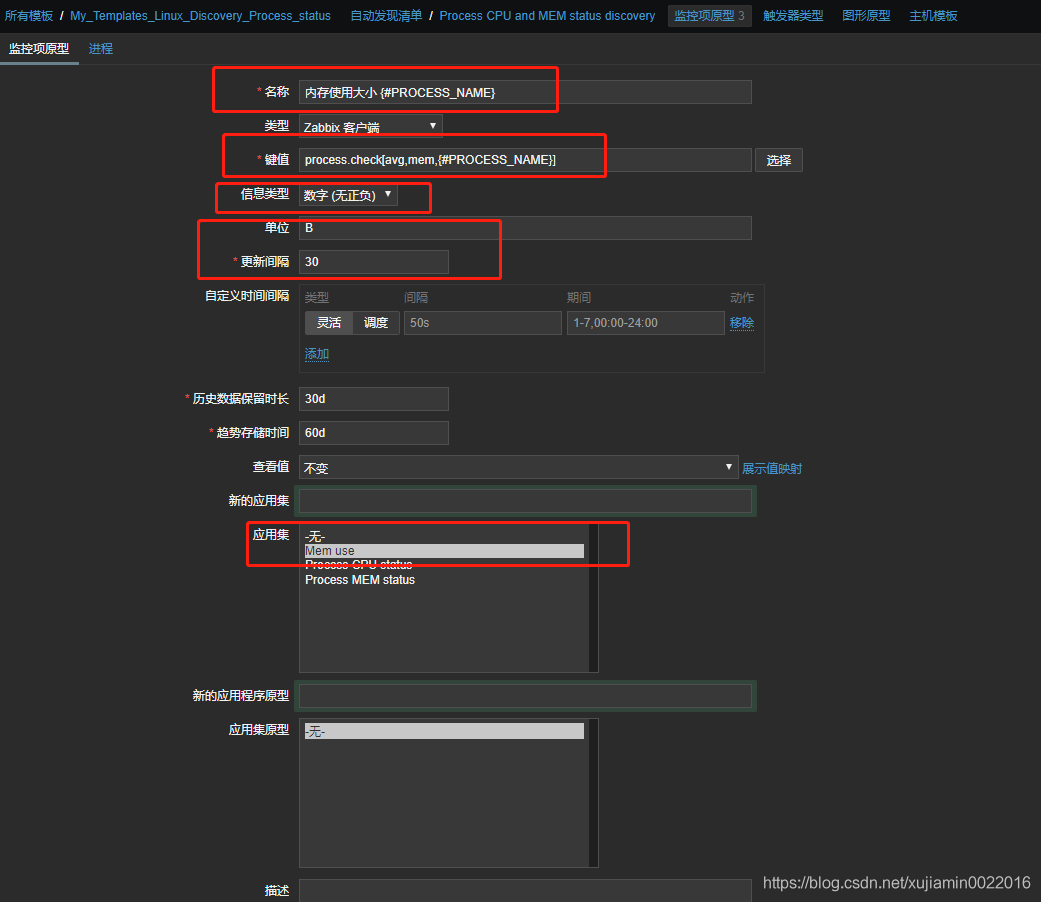
内存使用大小 {#PROCESS_NAME}
process.check[avg,mem,{#PROCESS_NAME}]
内存使用率 {#PROCESS_NAME}
保存之后模板就创建完成了
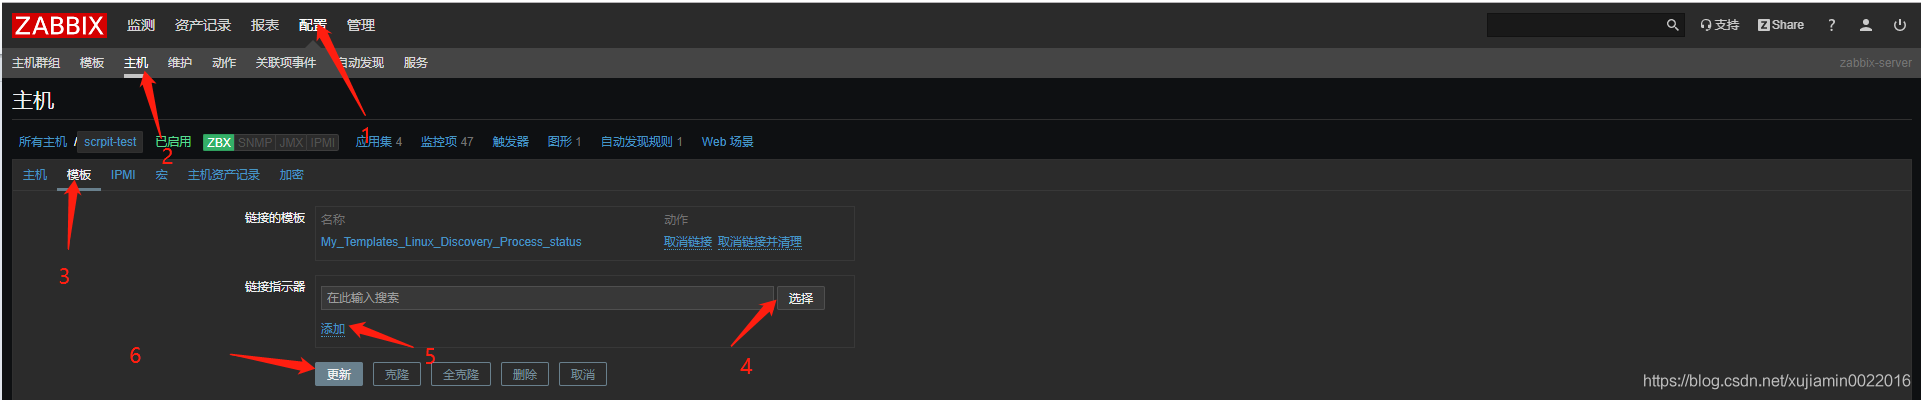
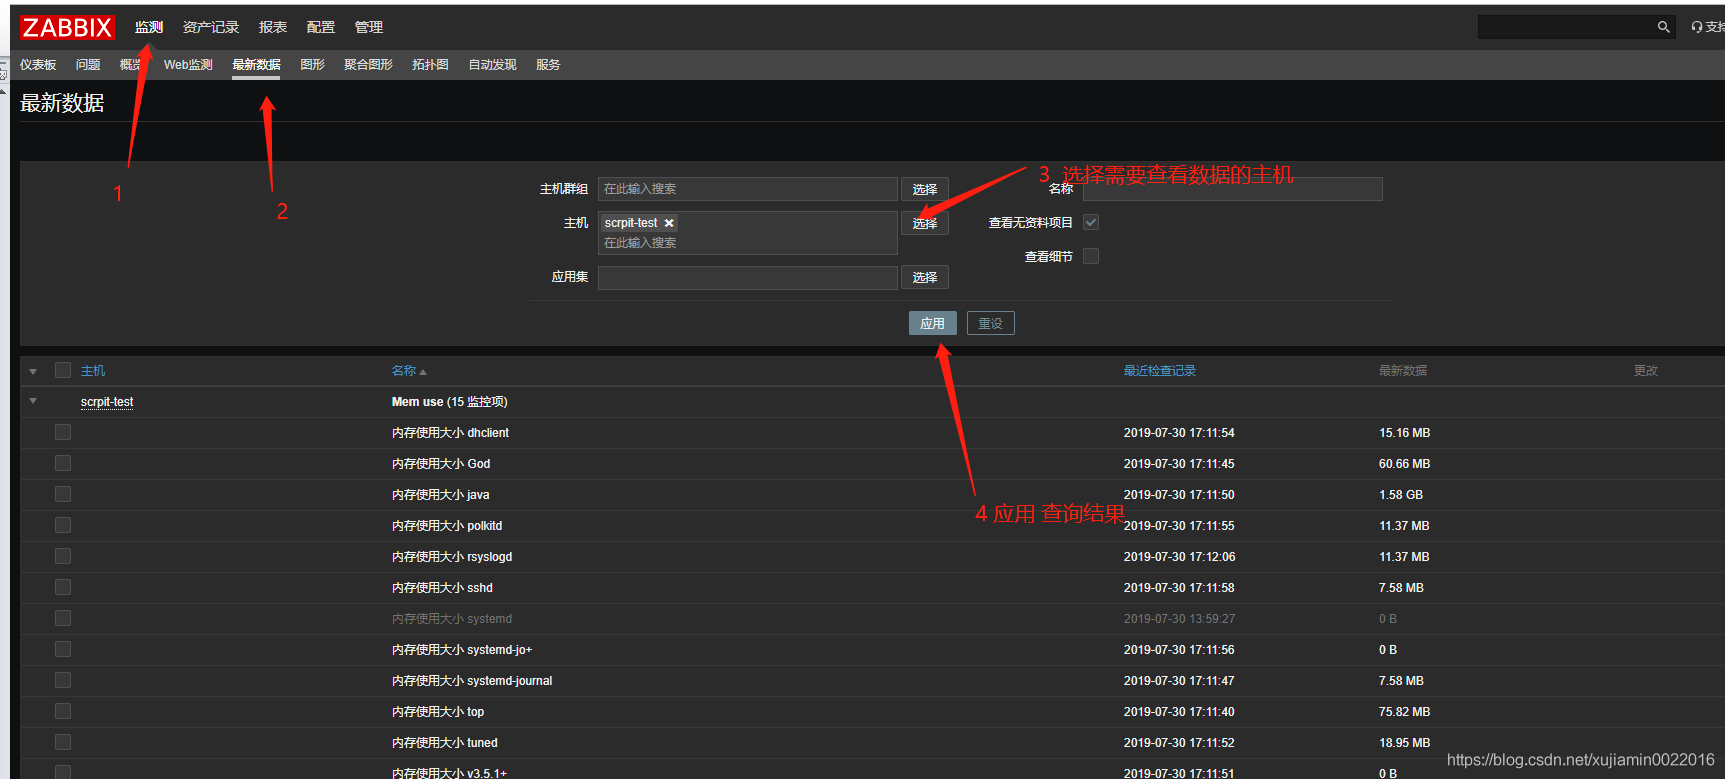
应用模板 选择需要应用模板的主机
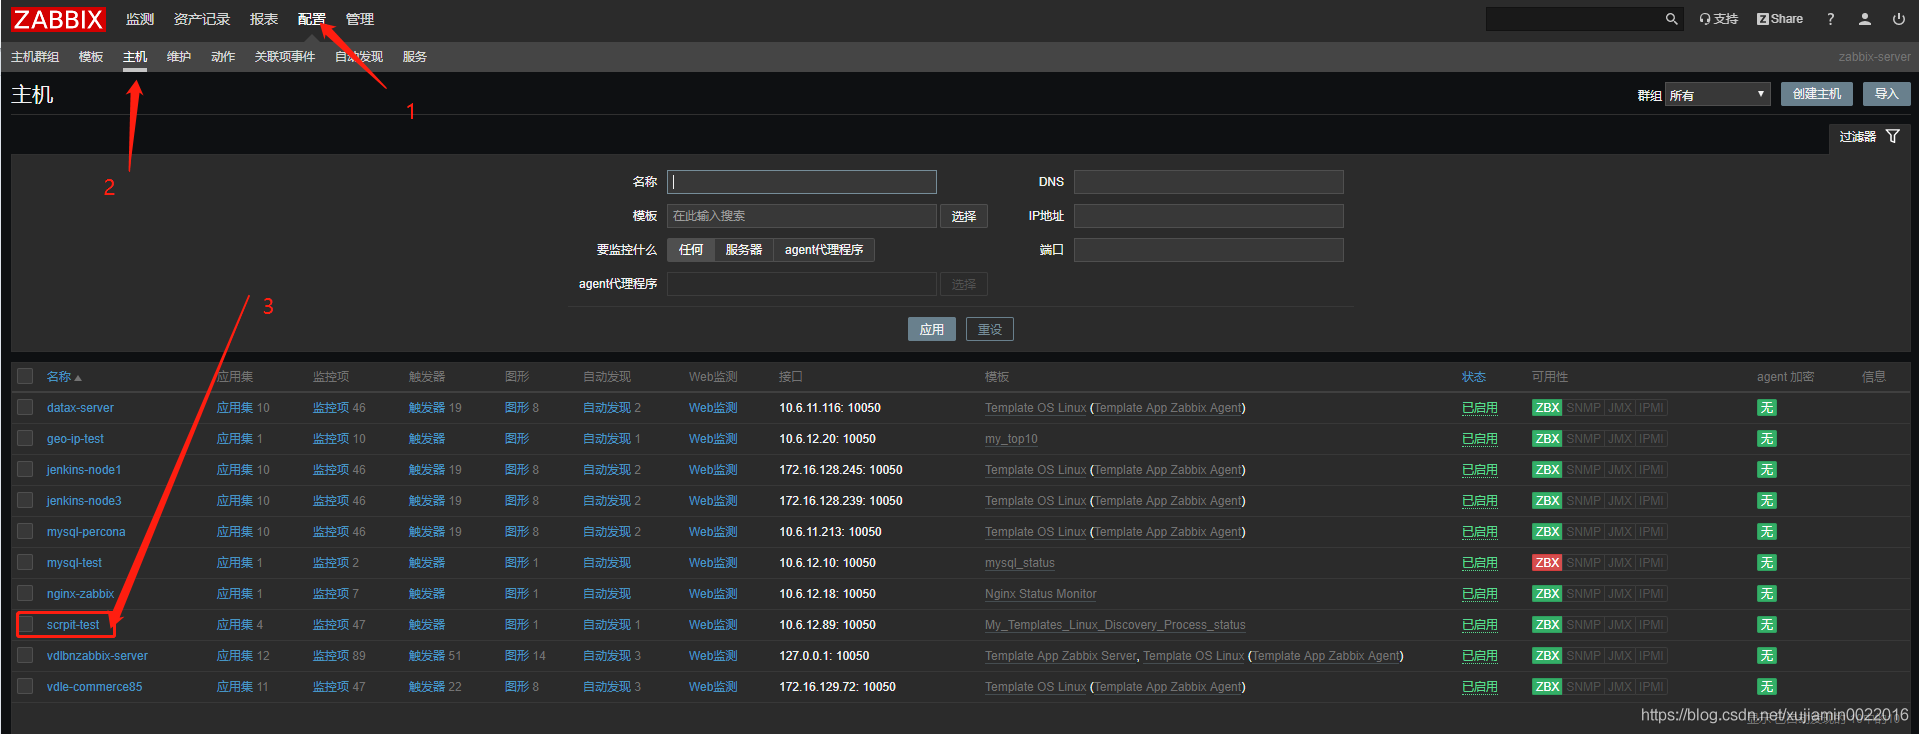
添加模板
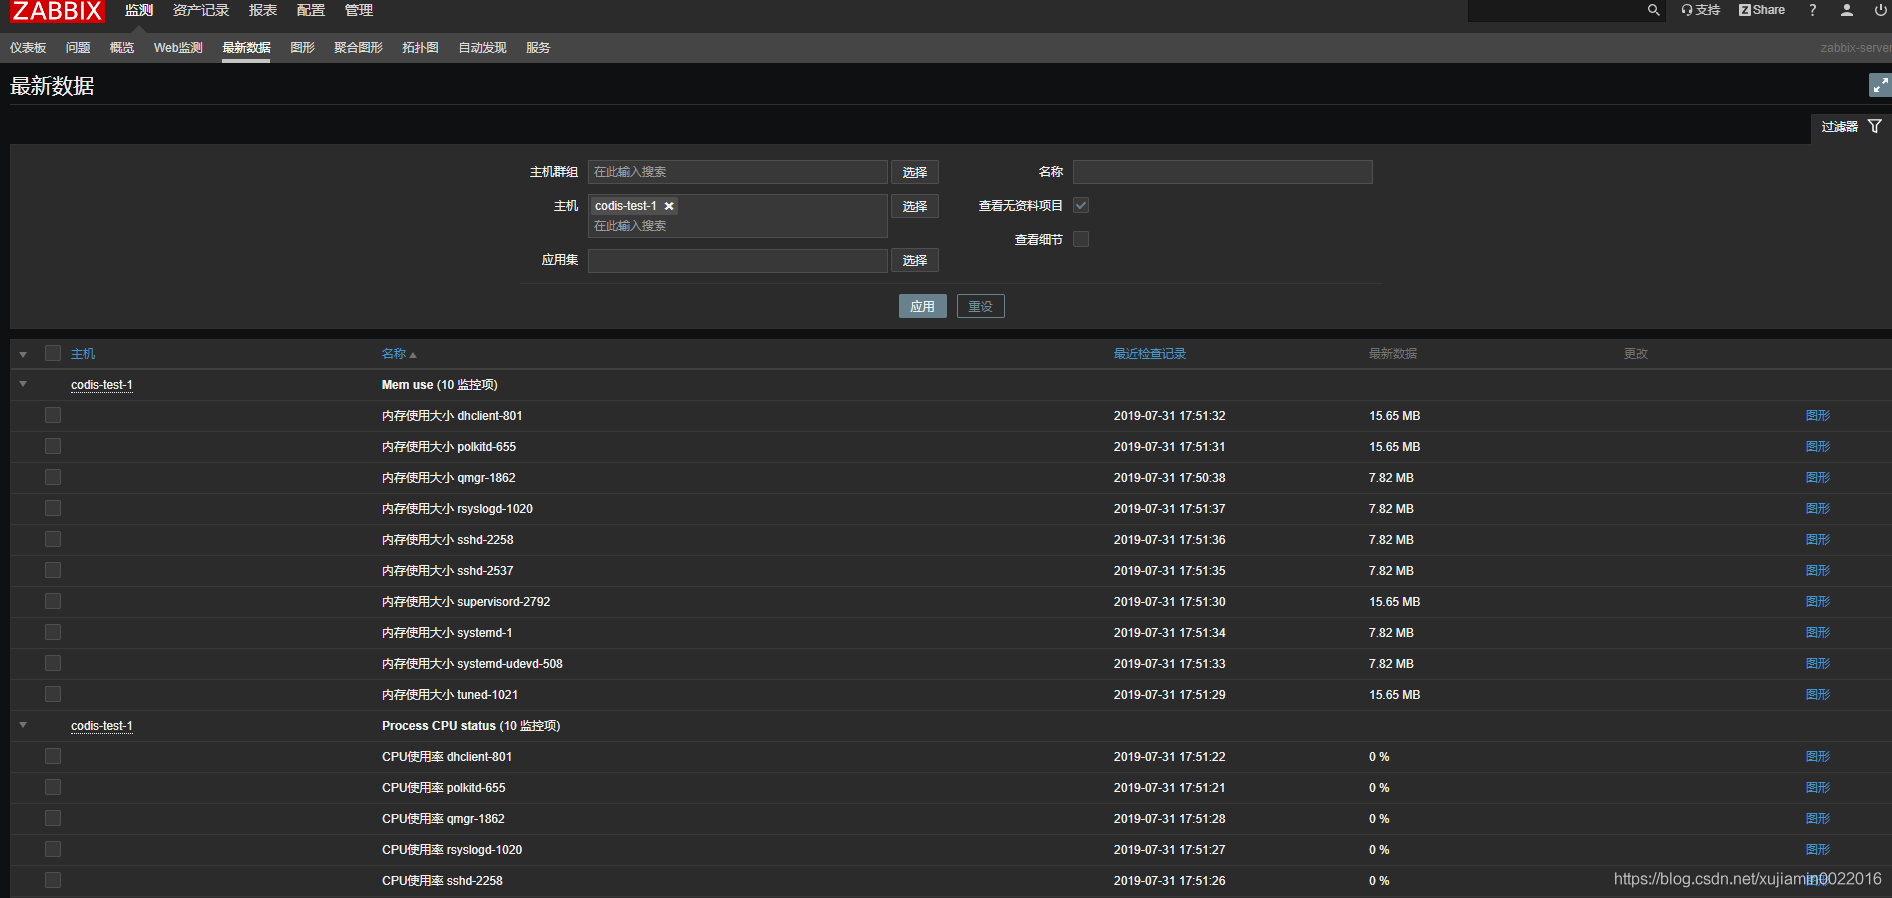
应用检测规则
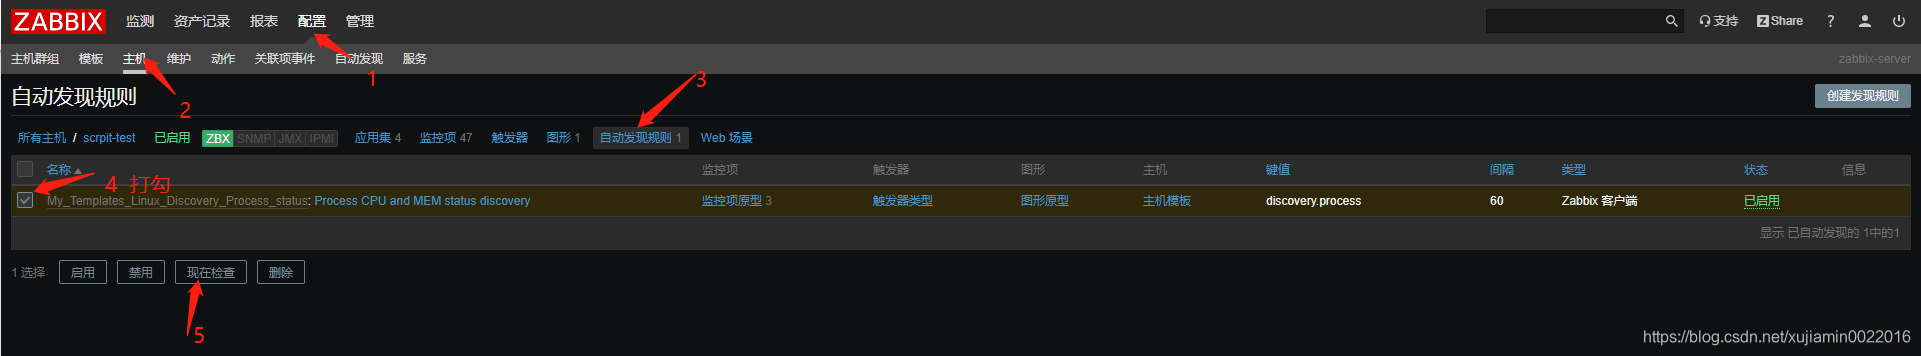
查询方式和结果如图
如果有需要可以创建图形
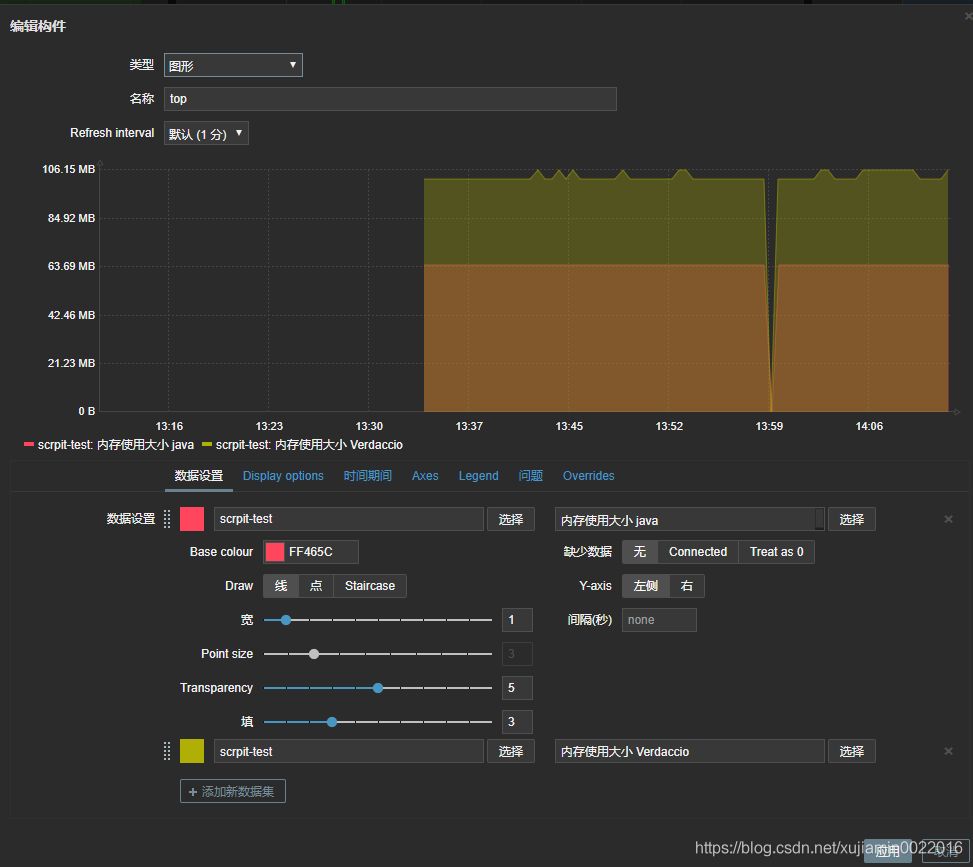
后续我自己监控的2项

也可以直接导入这个模板 先修改模板中需要自定义的参数.
模板地址
链接:https://pan.baidu.com/s/1Ul6iZxIWKdnVD8zPtMaFTQ
提取码:cdzb
复制这段内容后打开百度网盘手机App,操作更方便哦
这个模板的优势
1可以把GB显示的内存也统计进来
2统计了所有同类进程的内存 比如所有的java
这个模板的缺点 暂时发现
1 不能区分java的各个进程 没有进程号排查问题也比较吃力
2 不能完全显示所有进程的名称 后缀会用+代替或者显示不全
比如这个God 其实是pm2 的后缀,但是看起来就像是病毒的名称一样
过段时间 实践并修改
第一个问题想到可以修改一下显示的方式 这样java进程就不会叠加起来了
如果有进程号的话 进程名称显示不全问题也不是特别大
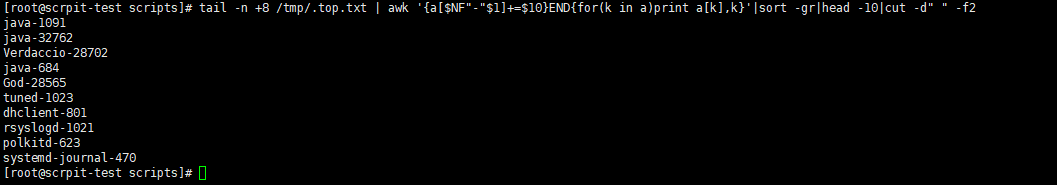
tail -n +8 /tmp/.top.txt | awk '{a[$NF"-"$1]+=$10}END{for(k in a)print a[k],k}'|sort -gr|head -10|cut -d" " -f2
https://blog.51cto.com/7424593/1908930
https://blog.csdn.net/oqqJohn1234567890/article/details/85330766
https://blog.csdn.net/liuxiangyang_/article/details/85758735
#将两个脚本改成如下
| [root@codis-test-1 scripts]# cat discovery_process.sh #!/bin/bash #system process discovery script #top -b -n 1 -w512 > /tmp/.top.txt chown zabbix. /tmp/.top.txt proc_array=(`tail -n +8 /tmp/.top.txt | awk '{a[$NF"-"$1]+=$10}END{for(k in a)print a[k],k}'|sort -gr|head -10|cut -d" " -f2`) length=${#proc_array[@]}
printf "{\n" printf '\t'"\"data\":[" for ((i=0;i<$length;i++)) do printf "\n\t\t{" printf "\"{#PROCESS_NAME}\":\"${proc_array[$i]}\"}" if [ $i -lt $[$length-1] ];then printf "," fi done printf "\n\t]\n" printf "}\n"
|
| [root@codis-test-1 scripts]# cat process_check.sh #!/bin/bash #system process CPU&MEM use information mode=$1 name=$2 process=$3 mem_total=$(cat /proc/meminfo | grep "MemTotal" | awk '{printf "%.f",$2/1024}') cpu_total=$(( $(cat /proc/cpuinfo | grep "processor" | wc -l) * 100 ))
function mempre { mem_pre=`tail -n +8 /tmp/.top.txt | awk '{a[$NF"-"$1]+=$10}END{for(k in a)print a[k],k}' | grep "\b${process}\b" | cut -d" " -f1` echo "$mem_pre" } #加\b 可以避免查mysql的时候mysql_safe的结果也被查出来 function memuse { mem_use=`tail -n +8 /tmp/.top.txt | awk '{a[$NF"-"$1]+=$10}END{for(k in a)print a[k]/100*'''${mem_total}''',k}' | grep "\b${process}\b" | cut -d" " -f1` echo "$mem_use" | awk '{printf "%.f",$1*1024*1024}' }
function cpuuse { cpu_use=`tail -n +8 /tmp/.top.txt | awk '{a[$NF"-"$1]+=$9}END{for(k in a)print a[k],k}' | grep "\b${process}\b" | cut -d" " -f1` echo "$cpu_use" }
function cpupre { cpu_pre=`tail -n +8 /tmp/.top.txt | awk '{a[$NF"-"$1]+=$9}END{for(k in a)print a[k]/('''${cpu_total}'''),k}' | grep "\b${process}\b" | cut -d" " -f1` echo "$cpu_pre" }
case $name in mem) if [ "$mode" = "pre" ];then mempre elif [ "$mode" = "avg" ];then memuse fi ;; cpu) if [ "$mode" = "pre" ];then cpupre elif [ "$mode" = "avg" ];then cpuuse fi ;; *) echo -e "Usage: $0 [mode : pre|avg] [mem|cpu] [process]" esac |
新创建的模板是这个 直接导入改一改就可以.其实脚本改了 用之前的模板应该也可以
但是这样会导致监控线里有很多很多项 不止10个.怎么监控还是要自己考虑.
链接:https://pan.baidu.com/s/1i8VyKOWFa8o9c2FWHTFpsg
提取码:2pxo
复制这段内容后打开百度网盘手机App,操作更方便哦


 被折叠的 条评论
为什么被折叠?
被折叠的 条评论
为什么被折叠?
 到【灌水乐园】发言


