


- <?php
- include ("src/jpgraph.php");
- include ("src/jpgraph_bar.php");
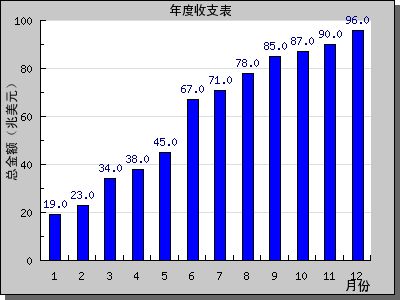
- $data = array(19,23,34,38,45,67,71,78,85,87,90,96); //定义数组
- $graph = new Graph(400,300); //创建新的Graph对象
- $graph->SetScale("textlin");
- $graph->SetShadow(); //设置阴影
- $graph->img->SetMargin(40,30,20,40); //设置边距
- $barplot = new BarPlot($data); //创建BarPlot对象
- $barplot->SetFillColor('blue'); //设置颜色
- $barplot->value->Show(); //设置显示数字
- $graph->Add($barplot); //将柱形图添加到图像中
- $graph->title->Set("年度收支表"); //设置标题和X-Y轴标题
- $graph->xaxis->title->Set("月份");
- $graph->yaxis->title->Set("总金额(兆美元)");
- $graph->title->SetFont(FF_SIMSUN,FS_BOLD); //设置字体
- $graph->yaxis->title->SetFont(FF_SIMSUN,FS_BOLD);
- $graph->xaxis->title->SetFont(FF_SIMSUN,FS_BOLD);
- $graph->Stroke();
- ?>


 被折叠的 条评论
为什么被折叠?
被折叠的 条评论
为什么被折叠?
 到【灌水乐园】发言


