


本文是把echarts封装成一个公共组件,方便调用,
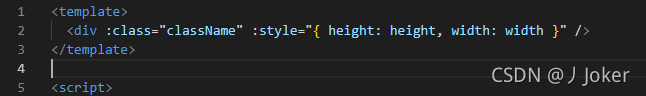
首先:先给echarts设置一个canvas画布,也就是俗称的div盒子
其次:下载echarts依赖,然后引入,如果报错的话就按照下面这种方式引入
macarons只是一个echarts的主题,当然也可以切换别的方式主题
debounde只是一个防抖的一个方法,可写可不写,流畅度,
现在准备工作,因为是作为公共组件,作为子组件,所以可以设置props来接受父组件的传值

现在就可以开始写方法:
 data() {
    return {
      chart: null,
      sidebarElm: null,
    };
  },
// 此方法是为了监听echarts根据变化数据而改变视图,!!!必写
  watch: {
    chartData: {
      deep: true,
      handler(val) {
        this.setOptions(val);
      },
    },
  },
  mounted() {
    this.initChart();
//此方法就是给echarts设置一个防抖动的处理
    if (this.autoResize) {
      this.__resizeHandler = debounce(() => {
        if (this.chart) {
          this.chart.resize();
        }
      }, 100);
      window.addEventListener("resize", this.__resizeHandler);
    }

    // 监听侧边栏的变化,此方法是针对于后台系统导航菜单来收缩展开,来监听echarts图的自适应,没有导航菜单的这个方法可以省略
    this.sidebarElm = document.getElementsByClassName("sidebartran")[0];
    this.sidebarElm &&
      this.sidebarElm.addEventListener(
        "transitionend",
        this.sidebarResizeHandler
      );
  },
  beforeDestroy() {
    if (!this.chart) {
      return;
    }
    if (this.autoResize) {
      window.removeEventListener("resize", this.__resizeHandler);
    }

    this.sidebarElm &&
      this.sidebarElm.removeEventListener(
        "transitionend",
        this.sidebarResizeHandler
      );

    this.chart.dispose();
    this.chart = null;
  },
  methods: {
//这个方法就是js里面一个特殊的属性 propertyName,这个是跟随上面监听侧边栏变化的一个处理,当监听到侧边栏的变化,会生成一个事件监听,而这个propertyName 就会监听到这个值,如果为“width”或者别的值如color之类的,echarts就会根据这些变化而自适应试图,自适应宽高
    sidebarResizeHandler(e) {
      if (e.propertyName === "width") {
        this.__resizeHandler();
      }
    },
//这个方法就是echarts里面的data值,echarts的数据都可以根据echarts文档api选择自己需要展示的数据来写在这
// 我这里的expectedData,和actualData 就是写成了动态数据由父组件传过来的,我只是选择了其中的一个data来作为动态传值,,当然在这里也是可以把整个setOption都写在父组件当成传值的
    setOptions({ expectedData, actualData } = {}) {
      this.chart.setOption({
        xAxis: {
          data: ["Mon", "Tue", "Wed", "Thu", "Fri", "Sat", "Sun"],
          boundaryGap: false,
          axisTick: {
            show: false,
          },
        },
        grid: {
          left: 10,
          right: 10,
          bottom: 20,
          top: 30,
          containLabel: true,
        },
        tooltip: {
          trigger: "axis",
          axisPointer: {
            type: "cross",
          },
          padding: [5, 10],
        },
        yAxis: {
          axisTick: {
            show: false,
          },
        },
        legend: {
          data: ["expected", "actual"],
        },
        series: [
          {
            name: "expected",
            itemStyle: {
              normal: {
                color: "#FF005A",
                lineStyle: {
                  color: "#FF005A",
                  width: 2,
                },
              },
            },
            smooth: true,
            type: "line",
            data: expectedData,
            animationDuration: 2800,
            animationEasing: "cubicInOut",
          },
          {
            name: "actual",
            smooth: true,
            type: "line",
            itemStyle: {
              normal: {
                color: "#3888fa",
                lineStyle: {
                  color: "#3888fa",
                  width: 2,
                },
                areaStyle: {
                  color: "#f3f8ff",
                },
              },
            },
            data: actualData,
            animationDuration: 2800,
            animationEasing: "quadraticOut",
          },
        ],
      });
    },
// 这个方法就是把setOptions里的数据渲染在页面上,渲染到画布canvas上
    initChart() {
      this.chart = echarts.init(this.$el, "macarons");
      this.setOptions(this.chartData);
    },
  },
成品就是这样的

作为组件可以方便来回调用,按照这个方法,就可以完成对echarts的封装了,


 973
973


 被折叠的 条评论
为什么被折叠?
被折叠的 条评论
为什么被折叠?
 到【灌水乐园】发言


