主流电商平台商品零售数据

提供部分主流电商平台店铺和商品多维分析数据,以主流电商平台、政府开放数据、线下调研数据为基础,结合大数据分析技术,提供多维度的查询和分析,辅助企业、机构和政府用户进行市场研究和商务决策。
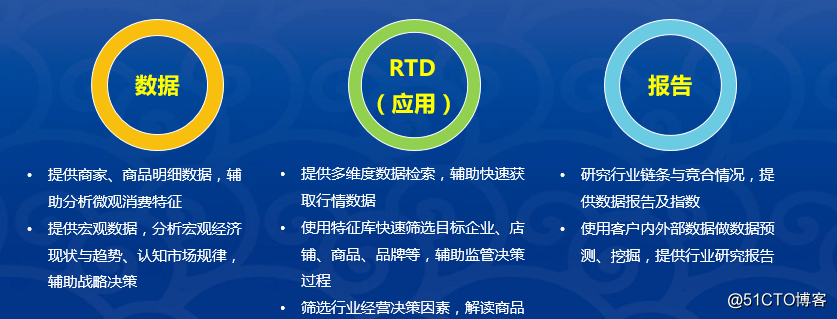
主流电商平台商品零售数据主流电商平台商品零售数据
主流电商平台商品零售数据

详情介绍

商品零售数据查询提供多维度的零售数据查询和分析,旨在帮助用户掌握商品零售的发展状况和趋势,剖析行业内部的结构组成,分析和对比地区的电商发展要素,辅助用户进行经济和商务决策。

看行情的时间范围2017年5-9月,查店品的时间范围2017年5-12月,覆盖部分主流电商平台。

   点击访问查询平台:[
  • 0
    点赞
  • 6
    收藏
    觉得还不错? 一键收藏
  • 1
    评论
Sure, I can help you with that. To crawl sales data for Huawei smartphones from popular e-commerce platforms and save it to a file named after your name, you can follow these steps: 1. Import the necessary libraries: ```python import requests import json ``` 2. Define a function to crawl the sales data from the e-commerce platform. Here's an example using JD.com (you can modify it for other platforms): ```python def crawl_sales_data(): url = "https://api.jd.com/routerjson" # Construct the request payload payload = { "method": "jd.union.open.goods.promotiongoodsinfo.query", "app_key": "your_app_key", "v": "1.0", "param_json": { "goodsReqDTO": { "eliteId": "1", "pageIndex": "1", "pageSize": "100", "sortName": "inOrderCount30DaysSku", "sort": "desc", "brandCode": "huawei", "categoryId": "", "owner": "pop" } } } # Send the request response = requests.post(url, json=payload) # Process the response if response.status_code == 200: data = json.loads(response.text) # Extract and save the sales data with open("your_name.txt", "w") as file: for item in data["result"]["data"]: file.write(f"Product Name: {item['skuName']}, Sales: {item['inOrderCount30DaysSku']}\n") print("Sales data saved successfully!") else: print("Failed to retrieve sales data!") ``` Note: You need to obtain your own app key from JD.com's developer platform and replace `"your_app_key"` with it. 3. Call the `crawl_sales_data()` function to crawl and save the sales data: ```python crawl_sales_data() ``` To analyze the data and visualize it, you can use libraries like pandas and matplotlib. Here's an example of how to do it: 1. Import the necessary libraries: ```python import pandas as pd import matplotlib.pyplot as plt ``` 2. Read the saved sales data from the file: ```python df = pd.read_csv("your_name.txt", delimiter=",", names=["Product Name", "Sales"]) ``` 3. Analyze the data: ```python # Get total sales total_sales = df["Sales"].sum() # Get top 5 products by sales top_products = df.nlargest(5, "Sales") # Get average sales average_sales = df["Sales"].mean() ``` 4. Visualize the data: ```python # Plot a bar chart of top products by sales plt.bar(top_products["Product Name"], top_products["Sales"]) plt.xlabel("Product") plt.ylabel("Sales") plt.title("Top 5 Products by Sales") plt.xticks(rotation=45) plt.show() # Display total sales and average sales print("Total Sales:", total_sales) print("Average Sales:", average_sales) ``` Remember to replace `"your_name.txt"` with the actual filename you used to save the data. I hope this helps you get started with crawling and analyzing sales data for Huawei smartphones from e-commerce platforms! Let me know if you have any further questions.

“相关推荐”对你有帮助么?

  • 非常没帮助
  • 没帮助
  • 一般
  • 有帮助
  • 非常有帮助
提交
评论 1
添加红包

请填写红包祝福语或标题

红包个数最小为10个

红包金额最低5元

当前余额3.43前往充值 >
需支付:10.00
成就一亿技术人!
领取后你会自动成为博主和红包主的粉丝 规则
hope_wisdom
发出的红包
实付
使用余额支付
点击重新获取
扫码支付
钱包余额 0

抵扣说明:

1.余额是钱包充值的虚拟货币,按照1:1的比例进行支付金额的抵扣。
2.余额无法直接购买下载,可以购买VIP、付费专栏及课程。

余额充值