


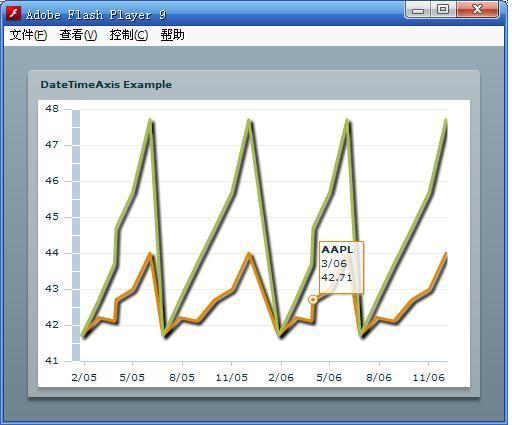
<?xml version="1.0"?> <!-- Simple example to demonstrate the DateTimeAxis class. --> <mx:Application xmlns:mx="http://www.adobe.com/2006/mxml"> <mx:Script> <!--[CDATA[ import mx.collections.ArrayCollection; [Bindable] public var stockDataAC:ArrayCollection = new ArrayCollection( [ {date: "2005, 1, 27", close: 41.71, next: 41.71}, {date: "2005, 2, 28", close: 42.21, next: 42.71}, {date: "2005, 3, 29", close: 42.11, next: 43.71}, {date: "2005, 4, 1", close: 42.71, next: 44.71}, {date: "2005, 5, 2", close: 42.99, next: 45.71}, {date: "2005, 6, 3", close: 44, next: 47.71}, {date: "2005, 6, 27", close: 41.71, next: 41.71}, {date: "2005, 7, 28", close: 42.21, next: 42.71}, {date: "2005, 8, 29", close: 42.11, next: 43.71}, {date: "2005, 10, 1", close: 42.71, next: 44.71}, {date: "2005, 11, 2", close: 42.99, next: 45.71}, {date: "2005, 12, 3", close: 44, next: 47.71} , {date: "2006, 1, 27", close: 41.71, next: 41.71}, {date: "2006, 2, 28", close: 42.21, next: 42.71}, {date: "2006, 3, 29", close: 42.11, next: 43.71}, {date: "2006, 4, 1", close: 42.71, next: 44.71}, {date: "2006, 5, 2", close: 42.99, next: 45.71}, {date: "2006, 6, 3", close: 44, next: 47.71}, {date: "2006, 6, 27", close: 41.71, next: 41.71}, {date: "2006, 7, 28", close: 42.21, next: 42.71}, {date: "2006, 8, 29", close: 42.11, next: 43.71}, {date: "2006, 10, 1", close: 42.71, next: 44.71}, {date: "2006, 11, 2", close: 42.99, next: 45.71}, {date: "2006, 12, 3", close: 44, next: 47.71} ]); public function myParseFunction(s:String):Date { // Get an array of Strings from the comma-separated String passed in. var a:Array = s.split(","); // Create the new Date object. Subtract one from // the month property because months are zero-based in // the Date constructor. var newDate:Date = new Date(a[0],a[1]-1,a[2]); return newDate; } ]]--> </mx:Script> <mx:Panel title="DateTimeAxis Example" height="100%" width="100%"> <mx:LineChart id="mychart" height="100%" width="100%" paddingRight="5" paddingLeft="5" showDataTips="true" dataProvider="{stockDataAC}" > <mx:horizontalAxis> <mx:DateTimeAxis dataUnits="days" parseFunction="myParseFunction"/> //时序图的时间设置 </mx:horizontalAxis> <mx:verticalAxis> <mx:LinearAxis baseAtZero="false" /> </mx:verticalAxis> <mx:series> <mx:LineSeries yField="close" xField="date" displayName="AAPL"/> <mx:LineSeries yField="next" xField="date" displayName="BBPL"/> </mx:series> </mx:LineChart> </mx:Panel> </mx:Application>
效果如图


 510
510

 被折叠的 条评论
为什么被折叠?
被折叠的 条评论
为什么被折叠?
 到【灌水乐园】发言


