SLA Monitor

The SLA management system mechanism represents a range of commercially available cloud management products that provide features pertaining to the administration, collection, storage, reporting, and runtime notification of SLA data.
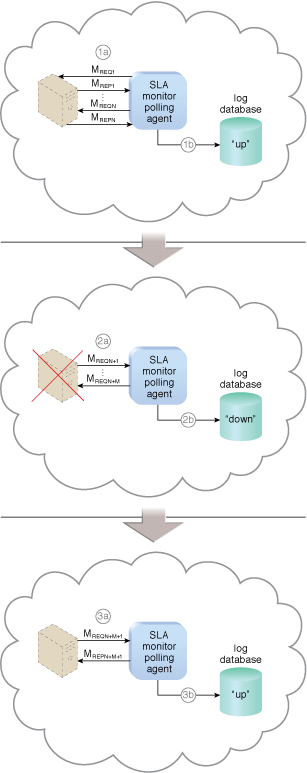
An SLA management system deployment will generally include a repository used to store and retrieve collected SLA data based on pre-defined metrics and reporting parameters. It will further rely on one or more SLA monitor mechanisms to collect the SLA data that can then be made available in near-realtime to usage and administration portals to provide ongoing feedback regarding active cloud services (Figure 1). The metrics monitored for individual cloud services are aligned with the SLA guarantees in corresponding cloud provisioning contracts.

Figure 1 - The SLA monitor polls the cloud service by sending over polling request messages (MREQ1 to MREQN). The monitor receives polling response messages (M to M ) that report that the service was "up" at each polling cycle (1a). The SLA monitor stores the "up" time—time period of all polling cycles 1 to N—in the log database (1b). The SLA monitor polls the cloud service that sends polling request messages (M to M ). Polling response messages are not received (2a). The response messages continue to time out, so the SLA monitor stores the "down" time—time period of all polling cycles N+1 to N+M—in the log database (2b). The SLA monitor sends a polling request message (M ) and receives the polling response message (M ) (3a). The SLA monitor stores the "up" time in the log database (3b).


 486
486

 被折叠的 条评论
为什么被折叠?


