


转载自 http://blog.csdn.net/littleboyandgirl/article/details/68486642
功能说明
- show profile 和 show profiles 语句可以展示当前会话(退出session后,profiling重置为0) 中执行语句的资源使用情况.
-
Profiling 功能由MySQL会话变量 : profiling控制,默认是OFF.关闭状态.
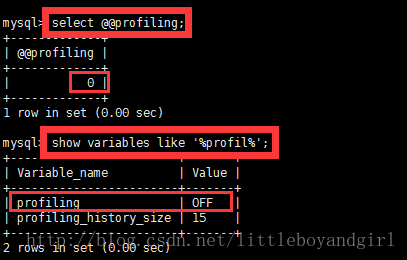
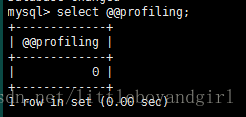
- select @@profiling;
- show variables like ‘%profil%’;
通过以上两个语句均可以查看 当前session是否打开了profile功能.
-
Profiling 信息收集依赖于调用 系统方法 getrusage().因此Windows系统不适用.
- 另外Profiling是针对进程(process)而非线程(threads),因此运行在服务器上的其他服务进程可能会影响分析结果.
语句使用
-
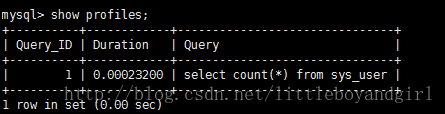
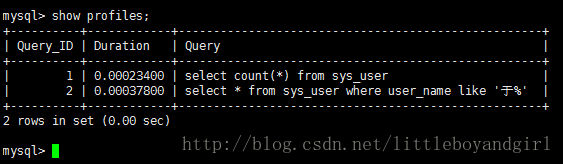
show profiles :列表,显示最近发送到服务器上执行的语句的资源使用情况.显示的记录数由变量:profiling_history_size 控制,默认15条.
-
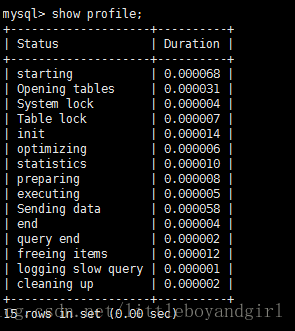
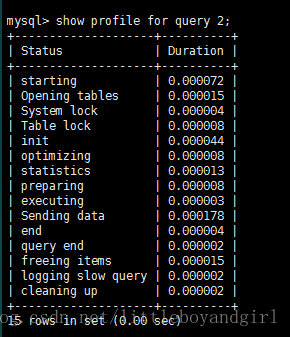
show profile: 展示最近一条语句执行的详细资源占用信息,默认显示 Status和Duration两列.
- show profile 还可根据 show profiles 列表中的 Query_ID ,选择显示某条记录的性能分析信息.
- 1
- 2
- 3
- 4
- 5
- 6
- 7
- 8
- 9
- 10
- 11
- 12
- 13
- 14
- 15
- 16
- 17
举例
-
查看是否打开了性能分析功能
- 1
-
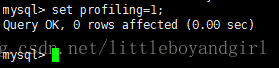
打开 profiling 功能
- 1
-
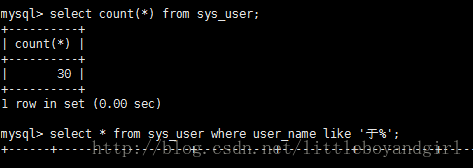
执行sql语句
-
执行 show profiles 查看分析列表
-
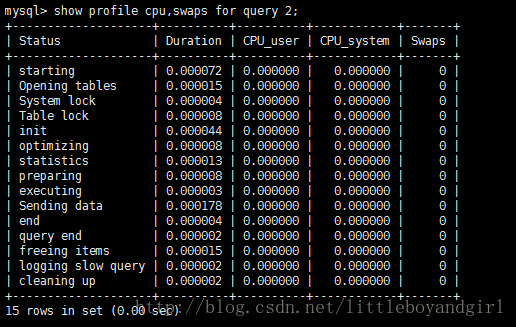
查询第二条语句的执行情况
- 1
- 可指定资源类型查询
show profile cpu,swaps for query 2;


 554
554


 被折叠的 条评论
为什么被折叠?
被折叠的 条评论
为什么被折叠?
 到【灌水乐园】发言


