oracle 11g 之 result cache

oracle 11g 之 result cache

  今天是2013-10-12,打算最近时间研究一下shared pool的相关原理以及awr报告分析。今天学习一下在oracle 11g shared pool中新增的一个cache 那就是result cache。

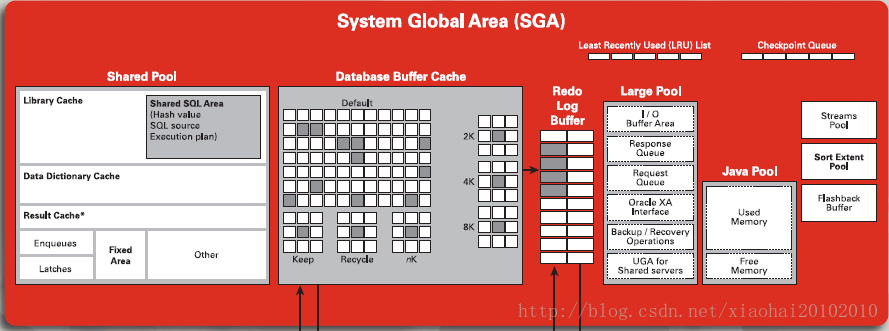
从上图可以看出在oracle 11g 的shared pool中存有对sql进行存储、存储sql执行计划、sql解析树等信息的library cache可以通过查看v$librarycahe视图了解其分配情况,以及row CACHE(data dictionary cache)可以查看v$rowcache视图了解其分配情况,对于这两部分内容咱不讨论,但是可以看一下如下这个图,大体明白这两个component的作用原理。


     现在开始研究一下result cache,对于oracle 11g 分为client result cache以及server result cache,前者在client进行内存的分配,后者对于数据库server进行内存分配,现在看一下server result cache(如下皆是server result cache内容)。说白了,result cache 就是为了缓存结果集的一块区域,主要是缓存sql 查询结果集以及pl/sql function结果集。

    对于 result cache存在几个参数,如下:

result_cache_max_result              integer     
result_cache_max_size                big integer 
result_cache_mode                    string      MANUAL(AUTO、FORCE)

1)、result_cache_max_result 表示对于单个的缓存结果占整个result cache 大小的百分比。

2)、result_cache_max_size 参数用于设置该result cache 的大小,是一个动态参数,该参数为0 则说明result cache 功能禁用了。

3)、result_cache_mode,表示result cache的模式,其中有manual、force。manual 表示只有使用hints(result_cache)才可以对其结果进行缓存且当从result cache中获取结果集的时候也必须使用hints(result cache)参数;force表示强制对结果集进行缓存 oracle对该参数的设置不建议,如下:

FORCE mode is not recommended because the database and clients will attempt to cache all queries, which may create significant performance and latching overhead. Moreover, because queries that call non-deterministic PL/SQL functions are also cached, enabling the result cache in such a broad-based manner may cause material changes to the results.

如果需要不对操作进行缓存可以使用hints(no_result_cache)进行设置。

如下是练习过程:

  一、 

     设置result cache 大小为20M,模式为manual,每个结果集占用总的cache比例为50%(为了测试方便);

  1. SQL> alter system set result_cache_mode=manual;  
  2.   
  3. System altered.  
  4.   
  5. SQL> alter system set  result_cache_max_result=50;  
  6.   
  7. System altered.  
  8.   
  9. SQL> show parameter result_cache  
  10.   
  11. NAME                                 TYPE        VALUE  
  12. ------------------------------------ ----------- ------------------------------  
  13. client_result_cache_lag              big integer 3000  
  14. client_result_cache_size             big integer 0  
  15. <span style="color:#ff6666">result_cache_max_result              integer     50  
  16. result_cache_max_size                big integer 20M  
  17. result_cache_mode                    string      MANUAL  
  18. </span>result_cache_remote_expiration       integer     0  
  19. SQL>   

那么启用result cache 与不启用的效果在那呢?如下测试见证分晓!

eg:

  1. SQL> set autotrace trace  
  2. SQL> select count(*) from rhys.amy;  
  3.   
  4.   
  5. Execution Plan  
  6. ----------------------------------------------------------  
  7. Plan hash value: 2204613761  
  8.   
  9. -------------------------------------------------------------------  
  10. | Id  | Operation          | Name | Rows  | Cost (%CPU)| Time     |  
  11. -------------------------------------------------------------------  
  12. |   0 | SELECT STATEMENT   |      |     1 |   348   (1)| 00:00:05 |  
  13. |   1 |  SORT AGGREGATE    |      |     1 |            |          |  
  14. |   2 |   TABLE ACCESS FULL| AMY  | 87260 |   348   (1)| 00:00:05 |  
  15. -------------------------------------------------------------------  
  16.   
  17.   
  18. Statistics  
  19. ----------------------------------------------------------  
  20.          61  recursive calls  
  21.           0  db block gets  
  22. <span style="color:#ff0000">       1271  consistent gets  
  23.        1246  physical reads  
  24. </span>          0  redo size  
  25.         528  bytes sent via SQL*Net to client  
  26.         523  bytes received via SQL*Net from client  
  27.           2  SQL*Net roundtrips to/from client  
  28.           5  sorts (memory)  
  29.           0  sorts (disk)  
  30.           1  rows processed  
  31.   
  32. <span style="color:#ff0000">SQL> r  
  33.   1* select count(*) from rhys.amy  
  34. </span>  
  35.   
  36. Execution Plan  
  37. ----------------------------------------------------------  
  38. Plan hash value: 2204613761  
  39.   
  40. -------------------------------------------------------------------  
  41. | Id  | Operation          | Name | Rows  | Cost (%CPU)| Time     |  
  42. -------------------------------------------------------------------  
  43. |   0 | SELECT STATEMENT   |      |     1 |   348   (1)| 00:00:05 |  
  44. |   1 |  SORT AGGREGATE    |      |     1 |            |          |  
  45. |   2 |   TABLE ACCESS FULL| AMY  | 87260 |   348   (1)| 00:00:05 |  
  46. -------------------------------------------------------------------  
  47.   
  48.   
  49. Statistics  
  50. ----------------------------------------------------------  
  51.           0  recursive calls  
  52.           0  db block gets  
  53.  <span style="color:#ff0000">      1248  consistent gets  
  54.        1246  physical reads  
  55. </span>          0  redo size  
  56.         528  bytes sent via SQL*Net to client  
  57.         523  bytes received via SQL*Net from client  
  58.           2  SQL*Net roundtrips to/from client  
  59.           0  sorts (memory)  
  60.           0  sorts (disk)  
  61.           1  rows processed  
  62.   
  63. SQL> r  
  64.   1* select count(*) from rhys.amy  
  65.   
  66.   
  67.   
  68. Execution Plan  
  69. ----------------------------------------------------------  
  70. Plan hash value: 2204613761  
  71.   
  72. -------------------------------------------------------------------  
  73. | Id  | Operation          | Name | Rows  | Cost (%CPU)| Time     |  
  74. -------------------------------------------------------------------  
  75. |   0 | SELECT STATEMENT   |      |     1 |   348   (1)| 00:00:05 |  
  76. |   1 |  SORT AGGREGATE    |      |     1 |            |          |  
  77. |   2 |   TABLE ACCESS FULL| AMY  | 87260 |   348   (1)| 00:00:05 |  
  78. -------------------------------------------------------------------  
  79.   
  80.   
  81. Statistics  
  82. ----------------------------------------------------------  
  83.           0  recursive calls  
  84.           0  db block gets  
  85. <span style="color:#ff0000">       1248  consistent gets  
  86.        1246  physical reads  
  87. </span>          0  redo size  
  88.         528  bytes sent via SQL*Net to client  
  89.         523  bytes received via SQL*Net from client  
  90.           2  SQL*Net roundtrips to/from client  
  91.           0  sorts (memory)  
  92.           0  sorts (disk)  
  93.           1  rows processed  
  94.   
  95. SQL> SQL>   
  96. SQL>   

首先看到查看rhys下的amy这张表在稳定下来的时候一致性读为1248,物理读为1246(万源之恶)。

现在使用result cache 功能。

  1. <span style="color:#ff0000">SQL> select /*+result_cache*/ count(*) from rhys.amy;  
  2. </span>  
  3.   
  4. Execution Plan  
  5. ----------------------------------------------------------  
  6. Plan hash value: 2204613761  
  7.   
  8. ------------------------------------------------------------------------------------------  
  9. | Id  | Operation           | Name                       | Rows  | Cost (%CPU)| Time     |  
  10. ------------------------------------------------------------------------------------------  
  11. |   0 | SELECT STATEMENT    |                            |     1 |   348   (1)| 00:00:05 |  
  12. |   1 |  RESULT CACHE       | 6tux55tbcpqfj66980yb24pfbh |       |            |          |  
  13. |   2 |   SORT AGGREGATE    |                            |     1 |            |          |  
  14. |   3 |    TABLE ACCESS FULL| AMY                        | 87260 |   348   (1)| 00:00:05 |  
  15. ------------------------------------------------------------------------------------------  
  16.   
  17. Result Cache Information (identified by operation id):  
  18. ------------------------------------------------------  
  19.   
  20.    1 - column-count=1; dependencies=(RHYS.AMY); attributes=(single-row); name="select /*+result_cache*/ count(*) from rhys.amy"  
  21.   
  22.   
  23. Statistics  
  24. ----------------------------------------------------------  
  25.           0  recursive calls  
  26.           0  db block gets  
  27. <span style="color:#ff0000">       1248  consistent gets  
  28.        1246  physical reads  
  29. </span>          0  redo size  
  30.         528  bytes sent via SQL*Net to client  
  31.         523  bytes received via SQL*Net from client  
  32.           2  SQL*Net roundtrips to/from client  
  33.           0  sorts (memory)  
  34.           0  sorts (disk)  
  35.           1  rows processed  

第一次执行该语句并将其缓存到result cache中,一致性读以及物理 读没有变化。

如下使用hints(result_cache)进行在此查询该结果集。如下:

  1. SQL> select /*+result_cache*/ count(*) from rhys.amy;  
  2.   
  3.   
  4. Execution Plan  
  5. ----------------------------------------------------------  
  6. Plan hash value: 2204613761  
  7.   
  8. ------------------------------------------------------------------------------------------  
  9. | Id  | Operation           | Name                       | Rows  | Cost (%CPU)| Time     |  
  10. ------------------------------------------------------------------------------------------  
  11. |   0 | SELECT STATEMENT    |                            |     1 |   348   (1)| 00:00:05 |  
  12. |   1 |  RESULT CACHE       | 6tux55tbcpqfj66980yb24pfbh |       |            |          |  
  13. |   2 |   SORT AGGREGATE    |                            |     1 |            |          |  
  14. |   3 |    TABLE ACCESS FULL| AMY                        | 87260 |   348   (1)| 00:00:05 |  
  15. ------------------------------------------------------------------------------------------  
  16.   
  17. Result Cache Information (identified by operation id):  
  18. ------------------------------------------------------  
  19.   
  20.    1 - column-count=1; dependencies=(RHYS.AMY); attributes=(single-row); name="select /*+result_cache*/ count(*) from rhys.amy"  
  21.   
  22.   
  23. Statistics  
  24. ----------------------------------------------------------  
  25.           0  recursive calls  
  26.           0  db block gets  
  27. <span style="color:#ff0000">          0  consistent gets  
  28.           0  physical reads  
  29. </span>          0  redo size  
  30.         528  bytes sent via SQL*Net to client  
  31.         523  bytes received via SQL*Net from client  
  32.           2  SQL*Net roundtrips to/from client  
  33.           0  sorts (memory)  
  34.           0  sorts (disk)  
  35.           1  rows processed  
  36.   
  37. SQL>   

可见物理读和一致性读都没有了,直接获得了结果集。这是好事啊。呵呵。

对于mode为force模式演示如下:

  1. <span style="color:#ff0000">SQL> alter system set result_cache_mode=force;  
  2. </span>  
  3. System altered.  
  4.   
  5. SQL>   
  6. SQL> set autotrace trace  
  7. SQL> select count(*) from rhys.amy;  
  8.   
  9.   
  10. Execution Plan  
  11. ----------------------------------------------------------  
  12. Plan hash value: 2204613761  
  13.   
  14. ------------------------------------------------------------------------------------------  
  15. | Id  | Operation           | Name                       | Rows  | Cost (%CPU)| Time     |  
  16. ------------------------------------------------------------------------------------------  
  17. |   0 | SELECT STATEMENT    |                            |     1 |   348   (1)| 00:00:05 |  
  18. |   1 |  RESULT CACHE       | 6tux55tbcpqfj66980yb24pfbh |       |            |          |  
  19. |   2 |   SORT AGGREGATE    |                            |     1 |            |          |  
  20. |   3 |    TABLE ACCESS FULL| AMY                        | 87260 |   348   (1)| 00:00:05 |  
  21. ------------------------------------------------------------------------------------------  
  22.   
  23. Result Cache Information (identified by operation id):  
  24. ------------------------------------------------------  
  25.   
  26.    1 - column-count=1; dependencies=(RHYS.AMY); attributes=(single-row); name="select count(*) from rhys.amy"  
  27.   
  28.   
  29. Statistics  
  30. ----------------------------------------------------------  
  31.          63  recursive calls  
  32.           8  db block gets  
  33. <span style="color:#ff0000">       1327  consistent gets  
  34.        1246  physical reads  
  35. </span>          0  redo size  
  36.         528  bytes sent via SQL*Net to client  
  37.         523  bytes received via SQL*Net from client  
  38.           2  SQL*Net roundtrips to/from client  
  39.          10  sorts (memory)  
  40.           0  sorts (disk)  
  41.           1  rows processed  
  42.   
  43. SQL> r  
  44.   1* select count(*) from rhys.amy  
  45.   
  46.   
  47. Execution Plan  
  48. ----------------------------------------------------------  
  49. Plan hash value: 2204613761  
  50.   
  51. ------------------------------------------------------------------------------------------  
  52. | Id  | Operation           | Name                       | Rows  | Cost (%CPU)| Time     |  
  53. ------------------------------------------------------------------------------------------  
  54. |   0 | SELECT STATEMENT    |                            |     1 |   348   (1)| 00:00:05 |  
  55. |   1 |  RESULT CACHE       | 6tux55tbcpqfj66980yb24pfbh |       |            |          |  
  56. |   2 |   SORT AGGREGATE    |                            |     1 |            |          |  
  57. |   3 |    TABLE ACCESS FULL| AMY                        | 87260 |   348   (1)| 00:00:05 |  
  58. ------------------------------------------------------------------------------------------  
  59.   
  60. Result Cache Information (identified by operation id):  
  61. ------------------------------------------------------  
  62.   
  63.    1 - column-count=1; dependencies=(RHYS.AMY); attributes=(single-row); name="select count(*) from rhys.amy"  
  64.   
  65.   
  66. Statistics  
  67. ----------------------------------------------------------  
  68.           0  recursive calls  
  69.           0  db block gets  
  70. <span style="color:#ff0000">          0  consistent gets  
  71.           0  physical reads  
  72. </span>          0  redo size  
  73.         528  bytes sent via SQL*Net to client  
  74.         523  bytes received via SQL*Net from client  
  75.           2  SQL*Net roundtrips to/from client  
  76.           0  sorts (memory)  
  77.           0  sorts (disk)  
  78.           1  rows processed  
  79.   
  80. SQL>   


另外在联机手册中并没提及到result_cache_mode 存在auto模式,但是我在不经意输错的是否发现了这个值。

SQL> alter system set result_cache_mode=false;
alter system set result_cache_mode=false
*
ERROR at line 1:
ORA-00096: invalid value FALSE for parameter result_cache_mode, must be from amongFORCE, MANUAL, AUTO

查看资料发现auto,是只有使用hints的时候才能起作用,但是当再次查询结果的时候没必要在使用hints了,而是直接把结果取出来。测试如下:

  1. SQL> set autotrace off  
  2. SQL> execute dbms_result_cache.flush;  
  3.   
  4. PL/SQL procedure successfully completed.  
  5.   
  6. <span style="color:#ff0000">SQL> alter system set result_cache_mode=auto;  
  7. </span>  
  8. System altered.  
  9.   
  10. SQL> set autotrace trace  
  11. SQL> select /*+result_cache*/ count(*) from rhys.amy;  
  12.   
  13.   
  14. Execution Plan  
  15. ----------------------------------------------------------  
  16. Plan hash value: 2204613761  
  17.   
  18. ------------------------------------------------------------------------------------------  
  19. | Id  | Operation           | Name                       | Rows  | Cost (%CPU)| Time     |  
  20. ------------------------------------------------------------------------------------------  
  21. |   0 | SELECT STATEMENT    |                            |     1 |   348   (1)| 00:00:05 |  
  22. |   1 |  RESULT CACHE       | 6tux55tbcpqfj66980yb24pfbh |       |            |          |  
  23. |   2 |   SORT AGGREGATE    |                            |     1 |            |          |  
  24. |   3 |    TABLE ACCESS FULL| AMY                        | 87260 |   348   (1)| 00:00:05 |  
  25. ------------------------------------------------------------------------------------------  
  26.   
  27. Result Cache Information (identified by operation id):  
  28. ------------------------------------------------------  
  29.   
  30.    1 - column-count=1; dependencies=(RHYS.AMY); attributes=(single-row); name="select /*+result_cache*/ count(*) from rhys.amy"  
  31.   
  32.   
  33. Statistics  
  34. ----------------------------------------------------------  
  35.          49  recursive calls  
  36.           0  db block gets  
  37.        1275  consistent gets  
  38.        1246  physical reads  
  39.           0  redo size  
  40.         528  bytes sent via SQL*Net to client  
  41.         523  bytes received via SQL*Net from client  
  42.           2  SQL*Net roundtrips to/from client  
  43.           5  sorts (memory)  
  44.           0  sorts (disk)  
  45.           1  rows processed  
  46.   
  47. SQL> r  
  48.   1* select /*+result_cache*/ count(*) from rhys.amy  
  49.   
  50.   
  51. Execution Plan  
  52. ----------------------------------------------------------  
  53. Plan hash value: 2204613761  
  54.   
  55. ------------------------------------------------------------------------------------------  
  56. | Id  | Operation           | Name                       | Rows  | Cost (%CPU)| Time     |  
  57. ------------------------------------------------------------------------------------------  
  58. |   0 | SELECT STATEMENT    |                            |     1 |   348   (1)| 00:00:05 |  
  59. |   1 |  RESULT CACHE       | 6tux55tbcpqfj66980yb24pfbh |       |            |          |  
  60. |   2 |   SORT AGGREGATE    |                            |     1 |            |          |  
  61. |   3 |    TABLE ACCESS FULL| AMY                        | 87260 |   348   (1)| 00:00:05 |  
  62. ------------------------------------------------------------------------------------------  
  63.   
  64. Result Cache Information (identified by operation id):  
  65. ------------------------------------------------------  
  66.   
  67.    1 - column-count=1; dependencies=(RHYS.AMY); attributes=(single-row); name="select /*+result_cache*/ count(*) from rhys.amy"  
  68.   
  69.   
  70. Statistics  
  71. ----------------------------------------------------------  
  72.           0  recursive calls  
  73.           0  db block gets  
  74.  <span style="color:#ff0000">         0  consistent gets  
  75.           0  physical reads  
  76. </span>          0  redo size  
  77.         528  bytes sent via SQL*Net to client  
  78.         523  bytes received via SQL*Net from client  
  79.           2  SQL*Net roundtrips to/from client  
  80.           0  sorts (memory)  
  81.           0  sorts (disk)  
  82.           1  rows processed  


二、

result cache 管理

对于11g中新增了result cache 那么也新增了4个视图以及一个包。

相关视图如下:

  • v$result_cache_dependency
  • v$result_cache_memory
  • v$result_cache_objects
  • v$result_cache_statistics

    就不在介绍了,可以参考联机手册进行分析以及学习:

    http://www.oracle.com/pls/db112/search?word=v$result_cache_

    现在看一个dbms_result_cache包:

    存在有6个subprograms,

    SubprogramDescription

    BYPASS Procedure

    Sets the bypass mode for the Result Cache

    FLUSH Function & Procedure

    Attempts to remove all the objects from the Result Cache, and depending on the arguments retains or releases the memory and retains or clears the statistics

    INVALIDATE Functions & Procedures

    Invalidates all the result-set objects that dependent upon the specified dependency object

    INVALIDATE_OBJECT Functions & Procedures

    Invalidates the specified result-set object(s)

    MEMORY_REPORT Procedure

    Produces the memory usage report for the Result Cache

    STATUS Function

    Checks the status of the Result Cache

    演示二个:

    其他参考:

    http://docs.oracle.com/cd/E11882_01/appdev.112/e40758/d_result_cache.htm#CHDJCFJG

    1. SQL> set serveroutput on  
    2. SQL> execute dbms_result_cache.memory_report;  
    3. R e s u l t   C a c h e   M e m o r y   R e p o r t  
    4. [Parameters]  
    5. Block Size          = 1K bytes  
    6. Maximum Cache Size  = 20M bytes (20K blocks)  
    7. Maximum Result Size = 10M bytes (10K blocks)  
    8. [Memory]  
    9. Total Memory = 168264 bytes [0.134% of the Shared Pool]  
    10. ... Fixed Memory = 5352 bytes [0.004% of the Shared Pool]  
    11. ... Dynamic Memory = 162912 bytes [0.129% of the Shared Pool]  
    12. ....... Overhead = 130144 bytes  
    13. ....... Cache Memory = 32K bytes (32 blocks)  
    14. ........... Unused Memory = 30 blocks  
    15. ........... Used Memory = 2 blocks  
    16. ............... Dependencies = 1 blocks (1 count)  
    17. ............... Results = 1 blocks  
    18. ................... SQL     = 1 blocks (1 count)  
    19.   
    20. PL/SQL procedure successfully completed.  
    21.   
    22. SQL> execute dbms_result_cache.memory_report(true);  
    23. R e s u l t   C a c h e   M e m o r y   R e p o r t  
    24. [Parameters]  
    25. Block Size          = 1K bytes  
    26. Maximum Cache Size  = 20M bytes (20K blocks)  
    27. Maximum Result Size = 10M bytes (10K blocks)  
    28. [Memory]  
    29. Total Memory = 168264 bytes [0.134% of the Shared Pool]  
    30. ... Fixed Memory = 5352 bytes [0.004% of the Shared Pool]  
    31. ....... Memory Mgr = 200 bytes  
    32. ....... Cache Mgr  = 208 bytes  
    33. ....... Bloom Fltr = 2K bytes  
    34. ....... State Objs = 2896 bytes  
    35. ... Dynamic Memory = 162912 bytes [0.129% of the Shared Pool]  
    36. ....... Overhead = 130144 bytes  
    37. ........... Hash Table    = 64K bytes (4K buckets)  
    38. ........... Chunk Ptrs    = 24K bytes (3K slots)  
    39. ........... Chunk Maps    = 12K bytes  
    40. ........... Miscellaneous = 130144 bytes  
    41. ....... Cache Memory = 32K bytes (32 blocks)  
    42. ........... Unused Memory = 30 blocks  
    43. ........... Used Memory = 2 blocks  
    44. ............... Dependencies = 1 blocks (1 count)  
    45. ............... Results = 1 blocks  
    46. ................... SQL     = 1 blocks (1 count)  
    47.   
    48. PL/SQL procedure successfully completed.  


    1. SQL> execute dbms_result_cache.flush;  
    2.   
    3. PL/SQL procedure successfully completed.  
    4.   
    5. SQL> execute dbms_result_cache.memory_report(true);  
    6. R e s u l t   C a c h e   M e m o r y   R e p o r t  
    7. [Parameters]  
    8. Block Size          = 0 bytes  
    9. Maximum Cache Size  = 0 bytes (0 blocks)  
    10. Maximum Result Size = 0 bytes (0 blocks)  
    11. [Memory]  
    12. Total Memory = 5352 bytes [0.004% of the Shared Pool]  
    13. ... Fixed Memory = 5352 bytes [0.004% of the Shared Pool]  
    14. ....... Memory Mgr = 200 bytes  
    15. ....... Cache Mgr  = 208 bytes  
    16. ....... Bloom Fltr = 2K bytes  
    17. ....... State Objs = 2896 bytes  
    18. ... Dynamic Memory = 0 bytes [0.000% of the Shared Pool]  
    19.   
    20. PL/SQL procedure successfully completed.  
    21.   
    22. SQL>   


评论
添加红包

请填写红包祝福语或标题

红包个数最小为10个

红包金额最低5元

当前余额3.43前往充值 >
需支付:10.00
成就一亿技术人!
领取后你会自动成为博主和红包主的粉丝 规则
hope_wisdom
发出的红包
实付
使用余额支付
点击重新获取
扫码支付
钱包余额 0

抵扣说明:

1.余额是钱包充值的虚拟货币,按照1:1的比例进行支付金额的抵扣。
2.余额无法直接购买下载,可以购买VIP、付费专栏及课程。

余额充值