


 本文介绍了如何利用开源库GraphView在Android中绘制数据统计曲线,特别适用于室内定位中的加速度传感器数据展示。首先从官方仓库下载.jar包,然后在Layout中添加GraphView。可以定制曲线标注、轴标签、轴范围以及图表缩放功能。此外,还能进行样式调整,如标签、背景色、字体等。
最近做室内定位需要绘出加速度传感器输出的三个方向的加速度曲线,找到了开源https://github.com/jjoe64/GraphView-Demos,省去了要重新学MatLab *=*。
在http://www.android-graphview.org/download--getting-started.html下载.jar包。
1、GraphView的使用和普通View的使用相同。在Layout中:
   <com.jjoe64.graphview.GraphView
        android:layout_width="match_parent"
        android:layout_height="200dip"
        android:id="@+id/graph" />
<span style="white-space:pre">		</span>GraphView graph = (GraphView) findViewById(R.id.graph);
		LineGraphSeries<DataPoint> series = new LineGraphSeries<DataPoint>(new DataPoint[] {
				 new DataPoint(0, 1),
	    			new DataPoint(1, 5),
	    			new DataPoint(2, 3),
	    			new DataPoint(3, 2),
	    			new DataPoint(4, 6)
		});
<span style="white-space:pre">		</span>graph.addSeries(series);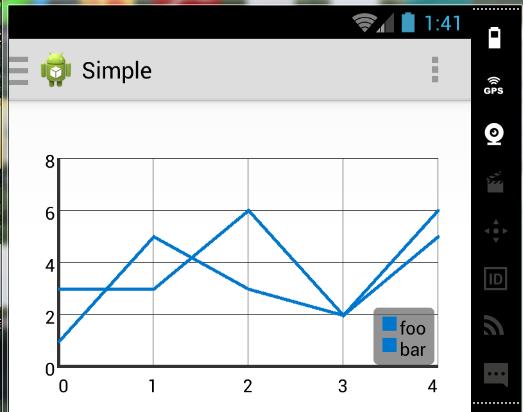
 GraphView graph = (GraphView) rootView.findViewById(R.id.graph);
        BarGraphSeries<DataPoint> series = new BarGraphSeries<DataPoint>(new DataPoint[] {
                new DataPoint(0, -2),
                new DataPoint(1, 5),
                new DataPoint(2, 3),
                new DataPoint(3, 2),
                new DataPoint(4, 6)
        });
        series.setSpacing(30);
        graph.addSeries(series);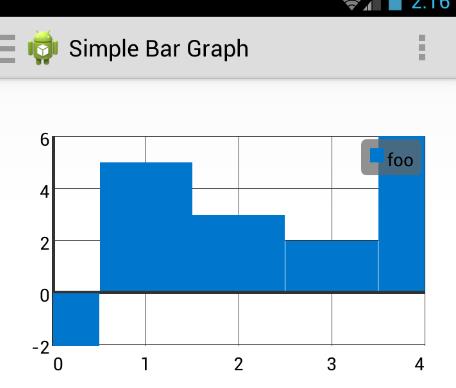
<span style="white-space:pre">	</span>PointsGraphSeries<DataPoint> series3 = new PointsGraphSeries<DataPoint>(new DataPoint[] {
			    new DataPoint(0, 0),
			    new DataPoint(1, 3),
			    new DataPoint(2, 1),
			    new DataPoint(3, 0),
			    new DataPoint(4, 4)
			});
			graph.addSeries(series3);
			series3.setShape(PointsGraphSeries.Shape.TRIANGLE);//设置点的形状
			series3.setColor(Color.YELLOW);
最低0.47元/天 解锁文章


 1942
1942

 被折叠的 条评论
为什么被折叠?
被折叠的 条评论
为什么被折叠?
 到【灌水乐园】发言


