import pandas as pd
import warnings
#ignore the warnings that generated by seaborn
warnings.filterwarnings('ignore')
import seaborn as sns
%matplotlib inline
import matplotlib.pyplot as plt

sns.set(style='white',color_codes=True)

#reas dateset
iris=pd.read_csv('Iris.csv')
iris.head()
Id
SepalLengthCm
SepalWidthCm
PetalLengthCm
PetalWidthCm
Species
0
1
5.1
3.5
1.4
0.2
Iris-setosa
1
2
4.9
3.0
1.4
0.2
Iris-setosa
2
3
4.7
3.2
1.3
0.2
Iris-setosa
3
4
4.6
3.1
1.5
0.2
Iris-setosa
4
5
5.0
3.6
1.4
0.2
Iris-setosa
#how many examples of each species
iris['Species'].value_counts()
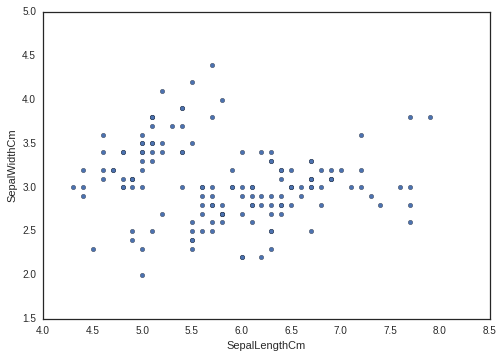
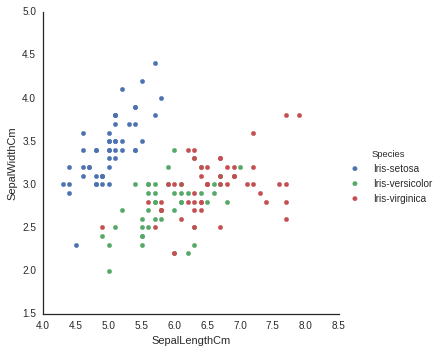
#add information fot what species each plant is
sns.FacetGrid(data=iris,hue='Species',size=5).map(plt.scatter,'SepalLengthCm','SepalWidthCm').add_legend()
<seaborn.axisgrid.FacetGrid at 0x7fa78c1f2940>
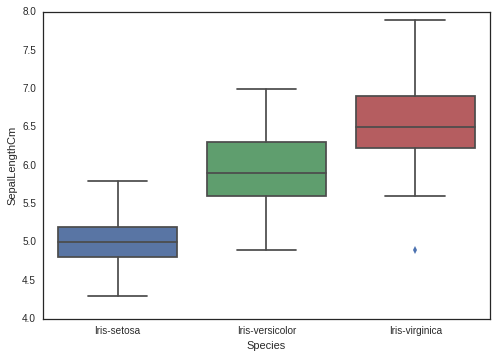
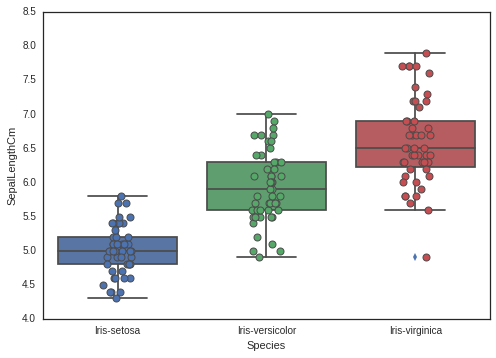
#look at individual feature in seaborn boxplot
sns.boxplot(x='Species',y='SepalLengthCm',data=iris)
<matplotlib.axes._subplots.AxesSubplot at 0x7fa78c0c52e8>


 2560
2560

 被折叠的 条评论
为什么被折叠?
被折叠的 条评论
为什么被折叠?
 到【灌水乐园】发言


