# Imports# pandasimport pandas as pd
from pandas import Series,DataFrame
# numpy, matplotlib, seabornimport numpy as np
import matplotlib.pyplot as plt
import seaborn as sns
sns.set_style('whitegrid')
%matplotlib inline
# machine learningfrom sklearn.linear_model import LogisticRegression
from sklearn.svm import SVC, LinearSVC
from sklearn.ensemble import RandomForestClassifier
from sklearn.neighbors import KNeighborsClassifier
from sklearn.naive_bayes import GaussianNB
# get titanic & test csv files as a DataFrame
titanic_df = pd.read_csv("train.csv", dtype={"Age": np.float64}, )
test_df    = pd.read_csv("test.csv", dtype={"Age": np.float64}, )

# preview the data
titanic_df.head()
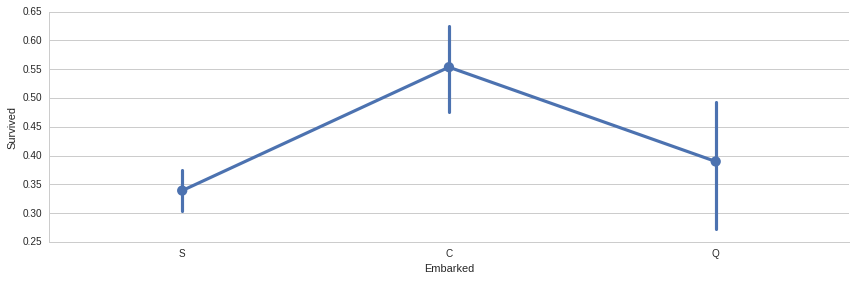
# Embarked# only in titanic_df, fill the two missing values with the most occurred value, which is "S".
titanic_df["Embarked"] = titanic_df["Embarked"].fillna("S")
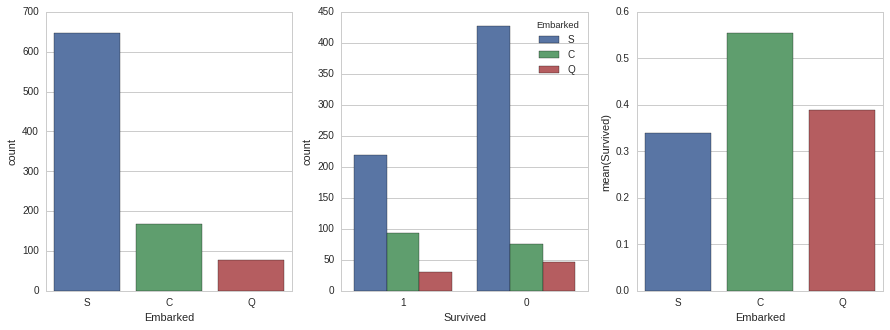
# plot
sns.factorplot('Embarked','Survived', data=titanic_df,size=4,aspect=3)
fig, (axis1,axis2,axis3) = plt.subplots(1,3,figsize=(15,5))
# sns.factorplot('Embarked',data=titanic_df,kind='count',order=['S','C','Q'],ax=axis1)# sns.factorplot('Survived',hue="Embarked",data=titanic_df,kind='count',order=[1,0],ax=axis2)
sns.countplot(x='Embarked', data=titanic_df, ax=axis1)
sns.countplot(x='Survived', hue="Embarked", data=titanic_df, order=[1,0], ax=axis2)
# group by embarked, and get the mean for survived passengers for each value in Embarked
embark_perc = titanic_df[["Embarked", "Survived"]].groupby(['Embarked'],as_index=False).mean()
sns.barplot(x='Embarked', y='Survived', data=embark_perc,order=['S','C','Q'],ax=axis3)
# Either to consider Embarked column in predictions,# and remove "S" dummy variable, # and leave "C" & "Q", since they seem to have a good rate for Survival.# OR, don't create dummy variables for Embarked column, just drop it, # because logically, Embarked doesn't seem to be useful in prediction.
embark_dummies_titanic = pd.get_dummies(titanic_df['Embarked'])
embark_dummies_titanic.drop(['S'], axis=1, inplace=True)
embark_dummies_test = pd.get_dummies(test_df['Embarked'])
embark_dummies_test.drop(['S'], axis=1, inplace=True)
titanic_df = titanic_df.join(embark_dummies_titanic)
test_df = test_df.join(embark_dummies_test)
titanic_df.drop(['Embarked'], axis=1,inplace=True)
test_df.drop(['Embarked'], axis=1,inplace=True)
/usr/lib/python3/dist-packages/matplotlib/__init__.py:894: UserWarning: axes.color_cycle is deprecated and replaced with axes.prop_cycle; please use the latter.
  warnings.warn(self.msg_depr % (key, alt_key))
test_df.info()
titanic_df.info()
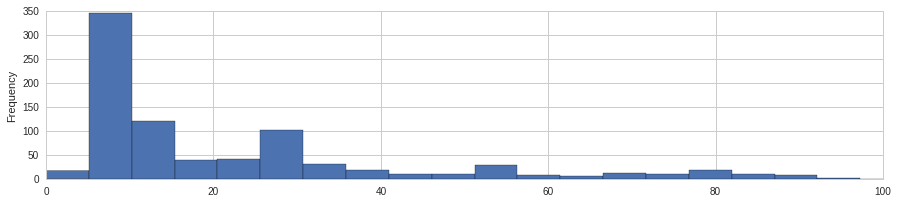
#fare#fill the missing "Fare" for the test_df
test_df['Fare'].fillna(test_df['Fare'].median(),inplace=True)
#convert from float to int
titanic_df['Fare']=titanic_df['Fare'].astype(int)
test_df['Fare']=test_df['Fare'].astype(int)
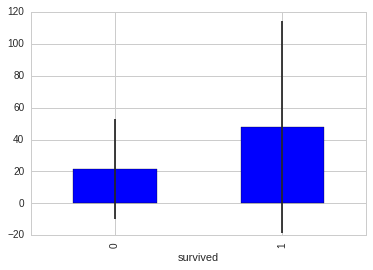
#get fare from survived and not survived
fare_not_survived=titanic_df['Fare'][titanic_df['Survived']==0]
fare_survived=titanic_df['Fare'][titanic_df['Survived']==1]
#get average and std fare from survived and unsurvived passengers
average_fare=DataFrame([fare_not_survived.mean(),fare_survived.mean()])
std_fare=DataFrame([fare_not_survived.std(),fare_survived.std()])
#plot
titanic_df['Fare'].plot(kind='hist',figsize=(15,3),bins=100,xlim=(titanic_df['Fare'].min(),100))
<matplotlib.axes._subplots.AxesSubplot at 0x7f554fe37b70>
<matplotlib.axes._subplots.AxesSubplot at 0x7f554fa62208>
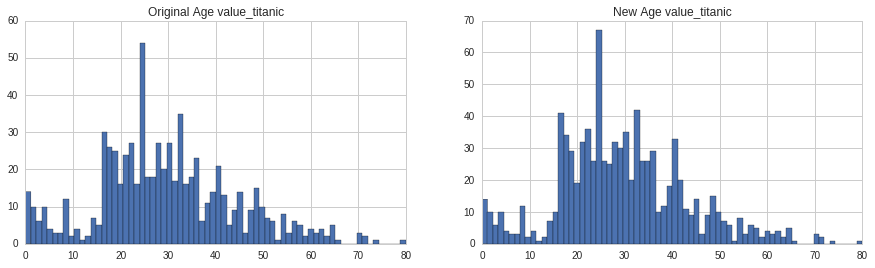
#age
fig,(axis1,axis2)=plt.subplots(1,2,figsize=(15,4))
axis1.set_title('Original Age value_titanic')
axis2.set_title('New Age value_titanic')

#get average,std and number of NaN values in titanic
average_age_titanic=titanic_df['Age'].mean()
std_age_titanic=titanic_df['Age'].std()
number_of_nan_titanic=titanic_df['Age'].isnull().sum()

#get average,std and number of NaN values in test
average_age_test=test_df['Age'].mean()
std_age_test=test_df['Age'].std()
number_of_nan_test=test_df['Age'].isnull().sum()

#generate random values between average-std adn average+std
rand_1=np.random.randint(average_age_titanic-std_age_titanic,average_age_titanic+std_age_titanic,size=number_of_nan_titanic)
rand_2=np.random.randint(average_age_test-std_age_test,average_age_test+std_age_test,size=number_of_nan_test)

#plot the originial age value_titanic
titanic_df['Age'].dropna().astype(int).hist(bins=70, ax=axis1)

#fill NaN values in age with random age genetated
titanic_df['Age'][np.isnan(titanic_df['Age'])]=rand_1
test_df['Age'][np.isnan(test_df['Age'])]=rand_2

#convert from float to int
titanic_df['Age']=titanic_df['Age'].astype(int)
test_df['Age']=test_df['Age'].astype(int)

#plot new age value_titanic
titanic_df['Age'].hist(bins=70,ax=axis2)
/usr/local/lib/python3.5/dist-packages/ipykernel/__main__.py:24: SettingWithCopyWarning:
A value is trying to be set on a copy of a slice from a DataFrame

See the caveats in the documentation: http://pandas.pydata.org/pandas-docs/stable/indexing.html#indexing-view-versus-copy
/usr/local/lib/python3.5/dist-packages/ipykernel/__main__.py:25: SettingWithCopyWarning:
A value is trying to be set on a copy of a slice from a DataFrame

See the caveats in the documentation: http://pandas.pydata.org/pandas-docs/stable/indexing.html#indexing-view-versus-copy


<matplotlib.axes._subplots.AxesSubplot at 0x7f554f9ad518>
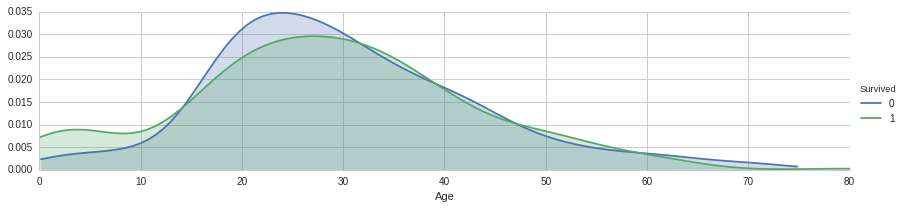
#continue plot age#peaks for survived /not survived by their age
facet=sns.FacetGrid(titanic_df,hue='Survived',aspect=4)
facet.map(sns.kdeplot,'Age',shade=True)
facet.set(xlim=(0,titanic_df['Age'].max()))
facet.add_legend()
/usr/lib/python3/dist-packages/matplotlib/__init__.py:894: UserWarning: axes.color_cycle is deprecated and replaced with axes.prop_cycle; please use the latter.
  warnings.warn(self.msg_depr % (key, alt_key))


<seaborn.axisgrid.FacetGrid at 0x7f554fac10b8>
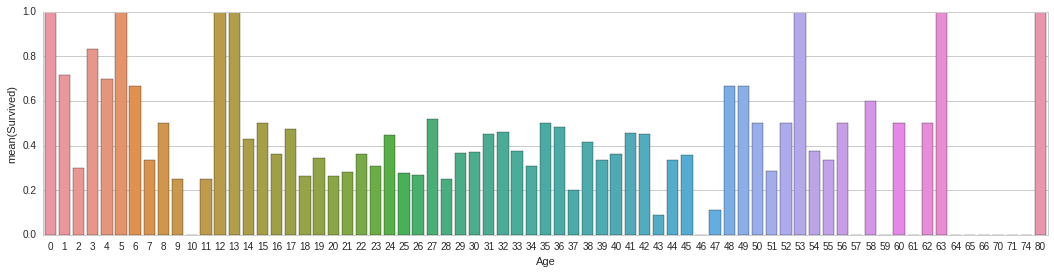
#average survived passengers by age
average_survived_by_age=titanic_df[["Age", "Survived"]].groupby(['Age'],as_index=False).mean()
fig,axis1=plt.subplots(1,1,figsize=(18,4))
sns.barplot(x='Age',y='Survived',data=average_survived_by_age)
/usr/lib/python3/dist-packages/matplotlib/__init__.py:894: UserWarning: axes.color_cycle is deprecated and replaced with axes.prop_cycle; please use the latter.
  warnings.warn(self.msg_depr % (key, alt_key))


<matplotlib.axes._subplots.AxesSubplot at 0x7f554f941a90>
#Cabin
#it has a lot of NaN values,so it can't have huge impact on predication
titanic_df.drop('Cabin',axis=1,inplace=True)
test_df.drop('Cabin',axis=1,inplace=True)
titanic_df.head()
Survived
Pclass
Sex
Age
SibSp
Parch
Fare
C
Q
0
0
3
male
22
1
0
7
0
0
1
1
1
female
38
1
0
71
1
0
2
1
3
female
26
0
0
7
0
0
3
1
1
female
35
1
0
53
0
0
4
0
3
male
35
0
0
8
0
0
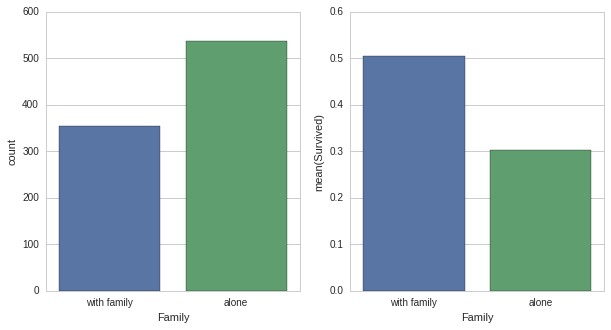
#Family#instead of having two columns Sibsp & Parch#we use only one column to represent whether the passenger has any family member on board #meaning , if has family on board if will increase of chance of survivl or not
titanic_df['Family']=titanic_df['SibSp']+titanic_df['Parch']
titanic_df['Family'].loc[titanic_df['Family']>0]=1
titanic_df['Family'].loc[titanic_df['Family']==0]=0
test_df['Family']=test_df['SibSp']+test_df['Parch']
test_df['Family'].loc[test_df['Family']>0]=1
test_df['Family'].loc[test_df['Family']==0]=0#drop SibSp & Parch
titanic_df=titanic_df.drop(['SibSp','Parch'],axis=1)
test_df=test_df.drop(['SibSp','Parch'],axis=1)
#plot
fig,(axis1,axis2)=plt.subplots(1,2,sharex=True,figsize=(10,5))
#countplot
sns.countplot(x='Family',data=titanic_df,order=[1,0],ax=axis1)
#average survival by Family
average_survival_by_Family=titanic_df[['Family','Survived']].groupby(['Family'],as_index=False).mean()
sns.barplot(x='Family',y='Survived',data=average_survival_by_Family,order=[1,0],ax=axis2)
axis1.set_xticklabels(['with family','alone'],rotation=0)
/usr/lib/python3/dist-packages/pandas/core/indexing.py:117: SettingWithCopyWarning:
A value is trying to be set on a copy of a slice from a DataFrame

See the caveats in the documentation: http://pandas.pydata.org/pandas-docs/stable/indexing.html#indexing-view-versus-copy
  self._setitem_with_indexer(indexer, value)
/usr/lib/python3/dist-packages/matplotlib/__init__.py:894: UserWarning: axes.color_cycle is deprecated and replaced with axes.prop_cycle; please use the latter.
  warnings.warn(self.msg_depr % (key, alt_key))


[<matplotlib.text.Text at 0x7f554f65a8d0>,
 <matplotlib.text.Text at 0x7f554f6519b0>]
# Sex# As we see, children(age < ~16) on aboard seem to have a high chances for Survival.# So, we can classify passengers as males, females, and childdefget_person(passenger):
age,sex = passenger
if age<16:
return'child'else:
return sex
titanic_df['Person'] = titanic_df[['Age','Sex']].apply(get_person,axis=1)
test_df['Person'] = test_df[['Age','Sex']].apply(get_person,axis=1)
# No need to use Sex column since we created Person column
titanic_df.drop(['Sex'],axis=1,inplace=True)
test_df.drop(['Sex'],axis=1,inplace=True)
/usr/lib/python3/dist-packages/matplotlib/__init__.py:894: UserWarning: axes.color_cycle is deprecated and replaced with axes.prop_cycle; please use the latter. warnings.warn(self.msg_depr % (key, alt_key))
#drop person
titanic_df.drop(['Person'],axis=1,inplace=True)
test_df.drop(['Person'],axis=1,inplace=True)
/usr/lib/python3/dist-packages/matplotlib/__init__.py:894: UserWarning: axes.color_cycle is deprecated and replaced with axes.prop_cycle; please use the latter.
  warnings.warn(self.msg_depr % (key, alt_key))


<seaborn.axisgrid.FacetGrid at 0x7f554f7d8c18>
#defining the training and testing set
x_train=titanic_df.drop(['Survived'],axis=1)
y_train=titanic_df['Survived']
x_test=test_df.drop('PassengerId',axis=1)


 1577
1577

 被折叠的 条评论
为什么被折叠?
被折叠的 条评论
为什么被折叠?
 到【灌水乐园】发言


