


Android图表库MPAndroidChart(七)—饼状图可以再简单一点
接上文,今天实现的是用的很多的,作用在统计上的饼状图,我们看下今天的效果
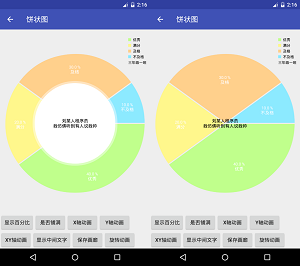
这个效果,我们实现,和之前一样的套路,我先来说下这个的应用场景,假设,我是一名小学老师,现在教务处让我设置一个图表,说明下我带的班级期末考试有多少人优秀,多少人及格和不及格等等,而这些呢,我已经算出来百分比了,只剩下画图了,那好,我们就来实现以下吧
一.基本实现
首先是我们的布局
 <com.github.mikephil.charting.charts.PieChart
        android:id="@+id/mPieChart"
        android:layout_width="match_parent"
        android:layout_height="0dp"
        android:layout_weight="1"/>
- 1
- 2
- 3
- 4
- 5

- 1
- 2
- 3
- 4
- 5
我们的饼状图是PieChart,然后进行初始化
        //饼状图
        mPieChart = (PieChart) findViewById(R.id.mPieChart);
        mPieChart.setUsePercentValues(true);
        mPieChart.getDescription().setEnabled(false);
        mPieChart.setExtraOffsets(5, 10, 5, 5);

        mPieChart.setDragDecelerationFrictionCoef(0.95f);
        //设置中间文件
        mPieChart.setCenterText(generateCenterSpannableText());

        mPieChart.setDrawHoleEnabled(true);
        mPieChart.setHoleColor(Color.WHITE);

        mPieChart.setTransparentCircleColor(Color.WHITE);
        mPieChart.setTransparentCircleAlpha(110);

        mPieChart.setHoleRadius(58f);
        mPieChart.setTransparentCircleRadius(61f);

        mPieChart.setDrawCenterText(true);

        mPieChart.setRotationAngle(0);
        // 触摸旋转
        mPieChart.setRotationEnabled(true);
        mPieChart.setHighlightPerTapEnabled(true);

        //变化监听
        mPieChart.setOnChartValueSelectedListener(this);
- 1
- 2
- 3
- 4
- 5
- 6
- 7
- 8
- 9
- 10
- 11
- 12
- 13
- 14
- 15
- 16
- 17
- 18
- 19
- 20
- 21
- 22
- 23
- 24
- 25
- 26
- 27
- 28
- 1
- 2
- 3
- 4
- 5
- 6
- 7
- 8
- 9
- 10
- 11
- 12
- 13
- 14
- 15
- 16
- 17
- 18
- 19
- 20
- 21
- 22
- 23
- 24
- 25
- 26
- 27
- 28
饼状图还是比较简单粗暴的,这里我们把数据写上去
        //模拟数据
        ArrayList<PieEntry> entries = new ArrayList<PieEntry>();
        entries.add(new PieEntry(40, "优秀"));
        entries.add(new PieEntry(20, "满分"));
        entries.add(new PieEntry(30, "及格"));
        entries.add(new PieEntry(10, "不及格"));

        //设置数据
        setData(entries);

        mPieChart.animateY(1400, Easing.EasingOption.EaseInOutQuad);

        Legend l = mPieChart.getLegend();
        l.setVerticalAlignment(Legend.LegendVerticalAlignment.TOP);
        l.setHorizontalAlignment(Legend.LegendHorizontalAlignment.RIGHT);
        l.setOrientation(Legend.LegendOrientation.VERTICAL);
        l.setDrawInside(false);
        l.setXEntrySpace(7f);
        l.setYEntrySpace(0f);
        l.setYOffset(0f);

        // 输入标签样式
        mPieChart.setEntryLabelColor(Color.WHITE);
        mPieChart.setEntryLabelTextSize(12f);
- 1
- 2
- 3
- 4
- 5
- 6
- 7
- 8
- 9
- 10
- 11
- 12
- 13
- 14
- 15
- 16
- 17
- 18
- 19
- 20
- 21
- 22
- 23
- 24
- 1
- 2
- 3
- 4
- 5
- 6
- 7
- 8
- 9
- 10
- 11
- 12
- 13
- 14
- 15
- 16
- 17
- 18
- 19
- 20
- 21
- 22
- 23
- 24
这里有一点要注意,他中间也是有文字的,当然,你也是可以关闭的,我们就不给他设置更多的属性了,大家有兴趣自己去实现下,我注释掉的部分
        //设置中间文字
        private SpannableString generateCenterSpannableText() {
        //原文:MPAndroidChart\ndeveloped by Philipp Jahoda
        SpannableString s = new SpannableString("刘某人程序员\n我仿佛听到有人说我帅");
        //s.setSpan(new RelativeSizeSpan(1.7f), 0, 14, 0);
        //s.setSpan(new StyleSpan(Typeface.NORMAL), 14, s.length() - 15, 0);
        // s.setSpan(new ForegroundColorSpan(Color.GRAY), 14, s.length() - 15, 0);
        //s.setSpan(new RelativeSizeSpan(.8f), 14, s.length() - 15, 0);
        // s.setSpan(new StyleSpan(Typeface.ITALIC), s.length() - 14, s.length(), 0);
        // s.setSpan(new ForegroundColorSpan(ColorTemplate.getHoloBlue()), s.length() - 14, s.length(), 0);
        return s;
    }
- 1
- 2
- 3
- 4
- 5
- 6
- 7
- 8
- 9
- 10
- 11
- 12
- 1
- 2
- 3
- 4
- 5
- 6
- 7
- 8
- 9
- 10
- 11
- 12
关于设置数据,就是调用我们的setdata方法
//设置数据
    private void setData(ArrayList<PieEntry> entries) {
        PieDataSet dataSet = new PieDataSet(entries, "三年级一班");
        dataSet.setSliceSpace(3f);
        dataSet.setSelectionShift(5f);

        //数据和颜色
        ArrayList<Integer> colors = new ArrayList<Integer>();
        for (int c : ColorTemplate.VORDIPLOM_COLORS)
            colors.add(c);
        for (int c : ColorTemplate.JOYFUL_COLORS)
            colors.add(c);
        for (int c : ColorTemplate.COLORFUL_COLORS)
            colors.add(c);
        for (int c : ColorTemplate.LIBERTY_COLORS)
            colors.add(c);
        for (int c : ColorTemplate.PASTEL_COLORS)
            colors.add(c);
        colors.add(ColorTemplate.getHoloBlue());
        dataSet.setColors(colors);
        PieData data = new PieData(dataSet);
        data.setValueFormatter(new PercentFormatter());
        data.setValueTextSize(11f);
        data.setValueTextColor(Color.WHITE);
        mPieChart.setData(data);
        mPieChart.highlightValues(null);
        //刷新
        mPieChart.invalidate();
    }
- 1
- 2
- 3
- 4
- 5
- 6
- 7
- 8
- 9
- 10
- 11
- 12
- 13
- 14
- 15
- 16
- 17
- 18
- 19
- 20
- 21
- 22
- 23
- 24
- 25
- 26
- 27
- 28
- 29
- 1
- 2
- 3
- 4
- 5
- 6
- 7
- 8
- 9
- 10
- 11
- 12
- 13
- 14
- 15
- 16
- 17
- 18
- 19
- 20
- 21
- 22
- 23
- 24
- 25
- 26
- 27
- 28
- 29
现在运行,就是实现的了,我们再来看下其他的效果
二.显示百分比
三.显示类型
四.x轴动画
五.y轴动画
六.xy轴动画
七.显示中间文字

八.旋转动画

这些细节都是一句话就能实现的,仔细看下嘛的代码
activity_piechart.xml
<?xml version="1.0" encoding="utf-8"?>
<LinearLayout
    xmlns:android="http://schemas.android.com/apk/res/android"
    android:layout_width="match_parent"
    android:layout_height="match_parent"
    android:orientation="vertical">

    <com.github.mikephil.charting.charts.PieChart
        android:id="@+id/mPieChart"
        android:layout_width="match_parent"
        android:layout_height="0dp"
        android:layout_weight="1"/>

    <LinearLayout
        android:layout_width="match_parent"
        android:layout_height="wrap_content"
        android:orientation="horizontal">

        <Button
            android:id="@+id/btn_show_percentage"
            android:layout_width="wrap_content"
            android:layout_height="wrap_content"
            android:text="显示百分比"/>

        <Button
            android:id="@+id/btn_show_type"
            android:layout_width="wrap_content"
            android:layout_height="wrap_content"
            android:text="是否铺满"/>

        <Button
            android:id="@+id/btn_anim_x"
            android:layout_width="wrap_content"
            android:layout_height="wrap_content"
            android:text="X轴动画"/>

        <Button
            android:id="@+id/btn_anim_y"
            android:layout_width="wrap_content"
            android:layout_height="wrap_content"
            android:text="Y轴动画"/>

    </LinearLayout>

    <LinearLayout
        android:layout_width="match_parent"
        android:layout_height="wrap_content"
        android:orientation="horizontal">

        <Button
            android:id="@+id/btn_anim_xy"
            android:layout_width="wrap_content"
            android:layout_height="wrap_content"
            android:text="XY轴动画"/>

        <Button
            android:id="@+id/btn_show_center_text"
            android:layout_width="wrap_content"
            android:layout_height="wrap_content"
            android:text="显示中间文字"/>

        <Button
            android:id="@+id/btn_save_pic"
            android:layout_width="wrap_content"
            android:layout_height="wrap_content"
            android:text="保存画廊"/>

        <Button
            android:id="@+id/btn_anim_rotating"
            android:layout_width="wrap_content"
            android:layout_height="wrap_content"
            android:text="旋转动画"/>

    </LinearLayout>

</LinearLayout>
- 1
- 2
- 3
- 4
- 5
- 6
- 7
- 8
- 9
- 10
- 11
- 12
- 13
- 14
- 15
- 16
- 17
- 18
- 19
- 20
- 21
- 22
- 23
- 24
- 25
- 26
- 27
- 28
- 29
- 30
- 31
- 32
- 33
- 34
- 35
- 36
- 37
- 38
- 39
- 40
- 41
- 42
- 43
- 44
- 45
- 46
- 47
- 48
- 49
- 50
- 51
- 52
- 53
- 54
- 55
- 56
- 57
- 58
- 59
- 60
- 61
- 62
- 63
- 64
- 65
- 66
- 67
- 68
- 69
- 70
- 71
- 72
- 73
- 74
- 75
- 76
PieChartActivity
public class PieChartActivity extends BaseActivity implements OnChartValueSelectedListener, View.OnClickListener {

    private PieChart mPieChart;

    //显示百分比
    private Button btn_show_percentage;
    //显示类型
    private Button btn_show_type;
    //x轴动画
    private Button btn_anim_x;
    //y轴动画
    private Button btn_anim_y;
    //xy轴动画
    private Button btn_anim_xy;
    //保存到sd卡
    private Button btn_save_pic;
    //显示中间文字
    private Button btn_show_center_text;
    //旋转动画
    private Button btn_anim_rotating;

    @Override
    protected void onCreate(Bundle savedInstanceState) {
        super.onCreate(savedInstanceState);
        setContentView(R.layout.activity_piechart);

        initView();
    }

    //初始化View
    private void initView() {

        btn_show_percentage = (Button) findViewById(R.id.btn_show_percentage);
        btn_show_percentage.setOnClickListener(this);
        btn_show_type = (Button) findViewById(R.id.btn_show_type);
        btn_show_type.setOnClickListener(this);
        btn_anim_x = (Button) findViewById(R.id.btn_anim_x);
        btn_anim_x.setOnClickListener(this);
        btn_anim_y = (Button) findViewById(R.id.btn_anim_y);
        btn_anim_y.setOnClickListener(this);
        btn_anim_xy = (Button) findViewById(R.id.btn_anim_xy);
        btn_anim_xy.setOnClickListener(this);
        btn_save_pic = (Button) findViewById(R.id.btn_save_pic);
        btn_save_pic.setOnClickListener(this);
        btn_show_center_text = (Button) findViewById(R.id.btn_show_center_text);
        btn_show_center_text.setOnClickListener(this);
        btn_anim_rotating = (Button) findViewById(R.id.btn_anim_rotating);
        btn_anim_rotating.setOnClickListener(this);


        //饼状图
        mPieChart = (PieChart) findViewById(R.id.mPieChart);
        mPieChart.setUsePercentValues(true);
        mPieChart.getDescription().setEnabled(false);
        mPieChart.setExtraOffsets(5, 10, 5, 5);

        mPieChart.setDragDecelerationFrictionCoef(0.95f);
        //设置中间文件
        mPieChart.setCenterText(generateCenterSpannableText());

        mPieChart.setDrawHoleEnabled(true);
        mPieChart.setHoleColor(Color.WHITE);

        mPieChart.setTransparentCircleColor(Color.WHITE);
        mPieChart.setTransparentCircleAlpha(110);

        mPieChart.setHoleRadius(58f);
        mPieChart.setTransparentCircleRadius(61f);

        mPieChart.setDrawCenterText(true);

        mPieChart.setRotationAngle(0);
        // 触摸旋转
        mPieChart.setRotationEnabled(true);
        mPieChart.setHighlightPerTapEnabled(true);

        //变化监听
        mPieChart.setOnChartValueSelectedListener(this);

        //模拟数据
        ArrayList<PieEntry> entries = new ArrayList<PieEntry>();
        entries.add(new PieEntry(40, "优秀"));
        entries.add(new PieEntry(20, "满分"));
        entries.add(new PieEntry(30, "及格"));
        entries.add(new PieEntry(10, "不及格"));

        //设置数据
        setData(entries);

        mPieChart.animateY(1400, Easing.EasingOption.EaseInOutQuad);

        Legend l = mPieChart.getLegend();
        l.setVerticalAlignment(Legend.LegendVerticalAlignment.TOP);
        l.setHorizontalAlignment(Legend.LegendHorizontalAlignment.RIGHT);
        l.setOrientation(Legend.LegendOrientation.VERTICAL);
        l.setDrawInside(false);
        l.setXEntrySpace(7f);
        l.setYEntrySpace(0f);
        l.setYOffset(0f);

        // 输入标签样式
        mPieChart.setEntryLabelColor(Color.WHITE);
        mPieChart.setEntryLabelTextSize(12f);
    }

    //设置中间文字
    private SpannableString generateCenterSpannableText() {
        //原文:MPAndroidChart\ndeveloped by Philipp Jahoda
        SpannableString s = new SpannableString("刘某人程序员\n我仿佛听到有人说我帅");
        //s.setSpan(new RelativeSizeSpan(1.7f), 0, 14, 0);
        //s.setSpan(new StyleSpan(Typeface.NORMAL), 14, s.length() - 15, 0);
        // s.setSpan(new ForegroundColorSpan(Color.GRAY), 14, s.length() - 15, 0);
        //s.setSpan(new RelativeSizeSpan(.8f), 14, s.length() - 15, 0);
        // s.setSpan(new StyleSpan(Typeface.ITALIC), s.length() - 14, s.length(), 0);
        // s.setSpan(new ForegroundColorSpan(ColorTemplate.getHoloBlue()), s.length() - 14, s.length(), 0);
        return s;
    }

    //设置数据
    private void setData(ArrayList<PieEntry> entries) {
        PieDataSet dataSet = new PieDataSet(entries, "三年级一班");
        dataSet.setSliceSpace(3f);
        dataSet.setSelectionShift(5f);

        //数据和颜色
        ArrayList<Integer> colors = new ArrayList<Integer>();
        for (int c : ColorTemplate.VORDIPLOM_COLORS)
            colors.add(c);
        for (int c : ColorTemplate.JOYFUL_COLORS)
            colors.add(c);
        for (int c : ColorTemplate.COLORFUL_COLORS)
            colors.add(c);
        for (int c : ColorTemplate.LIBERTY_COLORS)
            colors.add(c);
        for (int c : ColorTemplate.PASTEL_COLORS)
            colors.add(c);
        colors.add(ColorTemplate.getHoloBlue());
        dataSet.setColors(colors);
        PieData data = new PieData(dataSet);
        data.setValueFormatter(new PercentFormatter());
        data.setValueTextSize(11f);
        data.setValueTextColor(Color.WHITE);
        mPieChart.setData(data);
        mPieChart.highlightValues(null);
        //刷新
        mPieChart.invalidate();
    }


    @Override
    public void onValueSelected(Entry e, Highlight h) {

    }

    @Override
    public void onNothingSelected() {

    }

    @Override
    public void onClick(View v) {
        switch (v.getId()) {
            //显示百分比
            case R.id.btn_show_percentage:
                for (IDataSet<?> set : mPieChart.getData().getDataSets())
                    set.setDrawValues(!set.isDrawValuesEnabled());

                mPieChart.invalidate();
                break;
            //显示类型
            case R.id.btn_show_type:
                if (mPieChart.isDrawHoleEnabled())
                    mPieChart.setDrawHoleEnabled(false);
                else
                    mPieChart.setDrawHoleEnabled(true);
                mPieChart.invalidate();
                break;
            //x轴动画
            case R.id.btn_anim_x:
                mPieChart.animateX(1400);
                break;
            //y轴动画
            case R.id.btn_anim_y:
                mPieChart.animateY(1400);
                break;
            //xy轴动画
            case R.id.btn_anim_xy:
                mPieChart.animateXY(1400, 1400);
                break;
            //保存到sd卡
            case R.id.btn_save_pic:
                mPieChart.saveToPath("title" + System.currentTimeMillis(), "");
                break;
            //显示中间文字
            case R.id.btn_show_center_text:
                if (mPieChart.isDrawCenterTextEnabled())
                    mPieChart.setDrawCenterText(false);
                else
                    mPieChart.setDrawCenterText(true);
                mPieChart.invalidate();
                break;
            //旋转动画
            case R.id.btn_anim_rotating:
                mPieChart.spin(1000, mPieChart.getRotationAngle(), mPieChart.getRotationAngle() + 360, Easing.EasingOption
                        .EaseInCubic);
                break;
        }
    }
}
- 1
- 2
- 3
- 4
- 5
- 6
- 7
- 8
- 9
- 10
- 11
- 12
- 13
- 14
- 15
- 16
- 17
- 18
- 19
- 20
- 21
- 22
- 23
- 24
- 25
- 26
- 27
- 28
- 29
- 30
- 31
- 32
- 33
- 34
- 35
- 36
- 37
- 38
- 39
- 40
- 41
- 42
- 43
- 44
- 45
- 46
- 47
- 48
- 49
- 50
- 51
- 52
- 53
- 54
- 55
- 56
- 57
- 58
- 59
- 60
- 61
- 62
- 63
- 64
- 65
- 66
- 67
- 68
- 69
- 70
- 71
- 72
- 73
- 74
- 75
- 76
- 77
- 78
- 79
- 80
- 81
- 82
- 83
- 84
- 85
- 86
- 87
- 88
- 89
- 90
- 91
- 92
- 93
- 94
- 95
- 96
- 97
- 98
- 99
- 100
- 101
- 102
- 103
- 104
- 105
- 106
- 107
- 108
- 109
- 110
- 111
- 112
- 113
- 114
- 115
- 116
- 117
- 118
- 119
- 120
- 121
- 122
- 123
- 124
- 125
- 126
- 127
- 128
- 129
- 130
- 131
- 132
- 133
- 134
- 135
- 136
- 137
- 138
- 139
- 140
- 141
- 142
- 143
- 144
- 145
- 146
- 147
- 148
- 149
- 150
- 151
- 152
- 153
- 154
- 155
- 156
- 157
- 158
- 159
- 160
- 161
- 162
- 163
- 164
- 165
- 166
- 167
- 168
- 169
- 170
- 171
- 172
- 173
- 174
- 175
- 176
- 177
- 178
- 179
- 180
- 181
- 182
- 183
- 184
- 185
- 186
- 187
- 188
- 189
- 190
- 191
- 192
- 193
- 194
- 195
- 196
- 197
- 198
- 199
- 200
- 201
- 202
- 203
- 204
- 205
- 206
- 207
- 208
- 209
- 210
- 211
是不是觉得很欢快呢?就是这样,我都有考虑是不是要二次封装一个MP了,因为基本的套路都是一模一样的,好了,接下来,我们最后看下运行效果


 5773
5773

 被折叠的 条评论
为什么被折叠?
被折叠的 条评论
为什么被折叠?
 到【灌水乐园】发言


