


 这篇博客介绍了如何在地图上实现拖放交互功能,支持GPX、GeoJSON、IGC、KML和TopoJSON文件直接拖拽到地图上。但需要注意的是,该功能仅支持EPSG:4326和EPSG:3857投影的数据。
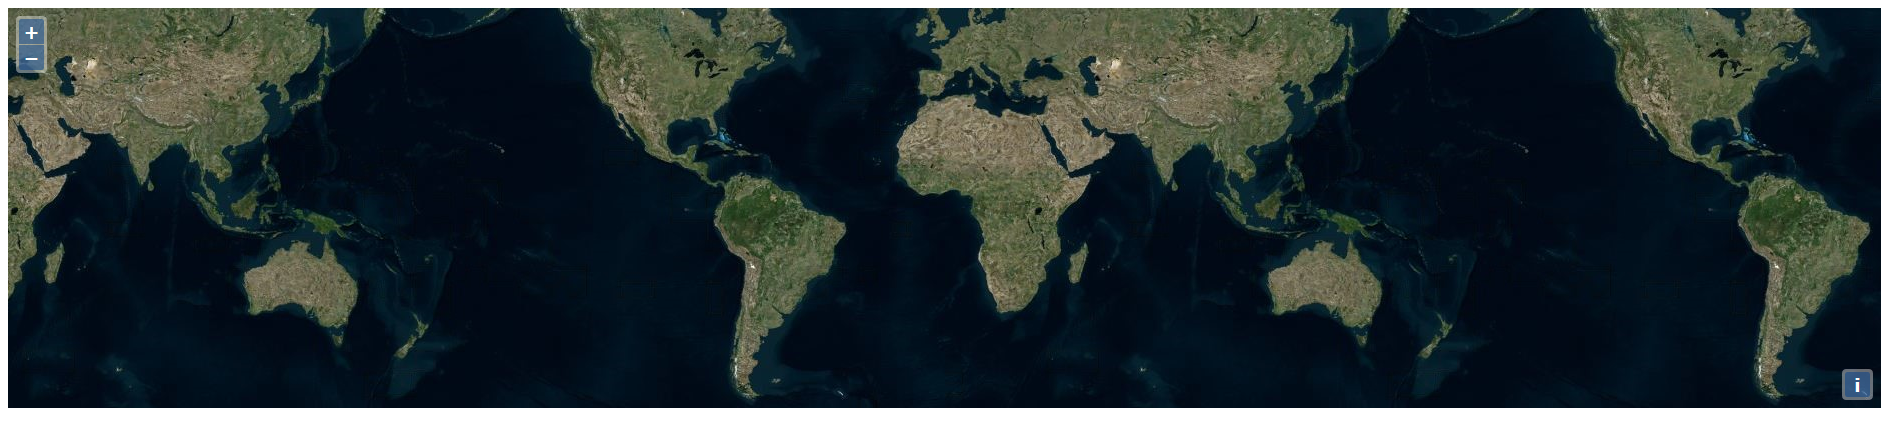
Example of using the drag-and-drop interaction. Drag and drop GPX, GeoJSON, IGC, KML, or TopoJSON files on to the map. There is no projection transform support, so this will only work with data in EPSG:4326 and EPSG:3857.
代码:
<!DOCTYPE html>
<html>
  <head>
    <title>Drag-and-Drop</title>
    <link rel="stylesheet" href="https://openlayers.org/en/v4.2.0/css/ol.css" type="text/css">
    <!-- The line below is only needed for old environments like Internet Explorer and Android 4.x -->
    <script src="https://cdn.polyfill.io/v2/polyfill.min.js?features=requestAnimationFrame,Element.prototype.classList,URL"></script>
    <script src="https://openlayers.org/en/v4.2.0/build/ol.js"></script>
  </head>
  <body>
    <div id="map" class="map"></div>
    <div id="info"> </div>
    <script>
      // 默认样式
      var defaultStyle = {
        'Point': new ol.style.Style({
          image: new ol.style.Circle({
            fill: new ol.style.Fill({
              color: 'rgba(255,255,0,0.5)'
            }),
            radius: 5,
            stroke: new ol.style.Stroke({
              color: '#ff0',
              width: 1
            })
          })
        }),
        'LineString': new ol.style.Style({
          stroke: new ol.style.Stroke({
            color: '#f00',
            width: 3
          })
        }),
        'Polygon': new ol.style.Style({
          fill: new ol.style.Fill({
            color: 'rgba(0,255,255,0.5)'
          }),
          stroke: new ol.style.Stroke({
            color: '#0ff',
            width: 1
          })
        }),
        'MultiPoint': new ol.style.Style({
          image: new ol.style.Circle({
            fill: new ol.style.Fill({
              color: 'rgba(255,0,255,0.5)'
            }),
            radius: 5,
            stroke: new ol.style.Stroke({
              color: '#f0f',
              width: 1
            })
          })
        }),
        'MultiLineString': new ol.style.Style({
          stroke: new ol.style.Stroke({
            color: '#0f0',
            width: 3
          })
        }),
        'MultiPolygon': new ol.style.Style({
          fill: new ol.style.Fill({
            color: 'rgba(0,0,255,0.5)'
          }),
          stroke: new ol.style.Stroke({
            color: '#00f',
            width: 1
          })
        })
      };

      // 样式函数
      var styleFunction = function(feature, resolution) {
        var featureStyleFunction = feature.getStyleFunction();
        if (featureStyleFunction) {
          return featureStyleFunction.call(feature, resolution);
        } else {
          return defaultStyle[feature.getGeometry().getType()];
        }
      };

      // 创建一个拖拽交互控件并制定可以支持的数据类型
      var dragAndDropInteraction = new ol.interaction.DragAndDrop({
        formatConstructors: [
          ol.format.GPX,
          ol.format.GeoJSON,
          ol.format.IGC,
          ol.format.KML,
          ol.format.TopoJSON
        ]
      });

      var map = new ol.Map({
        interactions: ol.interaction.defaults().extend([dragAndDropInteraction]),
        layers: [
          new ol.layer.Tile({
            source: new ol.source.BingMaps({
              imagerySet: 'Aerial',
              key: 'Your Bing Maps Key from http://www.bingmapsportal.com/ here'
            })
          })
        ],
        target: 'map',
        view: new ol.View({
          center: [0, 0],
          zoom: 2
        })
      });

      // 把数据拖拽进地图时自动添加为矢量图层
      dragAndDropInteraction.on('addfeatures', function(event) {
        var vectorSource = new ol.source.Vector({
          features: event.features
        });
        map.addLayer(new ol.layer.Vector({
          source: vectorSource,
          style: styleFunction
        }));
        map.getView().fit(vectorSource.getExtent());
      });

      // 显示要素信息
      var displayFeatureInfo = function(pixel) {
        var features = [];
        map.forEachFeatureAtPixel(pixel, function(feature) {
          features.push(feature);
        });
        if (features.length > 0) {
          var info = [];
          var i, ii;
          for (i = 0, ii = features.length; i < ii; ++i) {
            info.push(features[i].get('name'));
          }
          document.getElementById('info').innerHTML = info.join(', ') || ' ';
        } else {
          document.getElementById('info').innerHTML = ' ';
        }
      };

      // 鼠标移动到要素上的时候显示要素信息
      map.on('pointermove', function(evt) {
        if (evt.dragging) {
          return;
        }
        var pixel = map.getEventPixel(evt.originalEvent);
        displayFeatureInfo(pixel);
      });

      // 鼠标单击的时候显示要素信息
      map.on('click', function(evt) {
        displayFeatureInfo(evt.pixel);
      });
    </script>
  </body>
</html>


 1005
1005

 被折叠的 条评论
为什么被折叠?
被折叠的 条评论
为什么被折叠?
 到【灌水乐园】发言


