


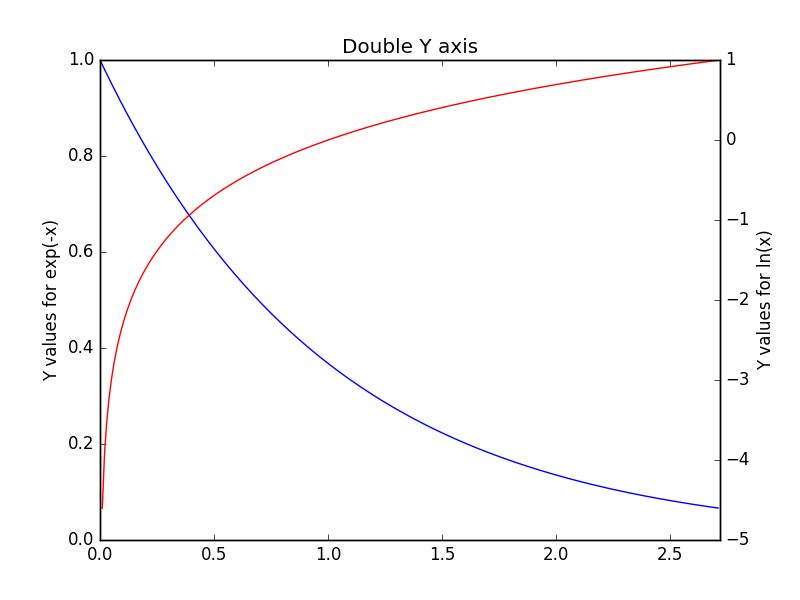
要点就是ax2 = ax1.twinx(), 制作一个兄弟轴。代码如下:
import matplotlib.pyplot as plt
import numpy as np

x = np.arange(0., np.e, 0.01)
y1 = np.exp(-x)
y2 = np.log(x)

fig = plt.figure()

ax1 = fig.add_subplot(111)
ax1.plot(x, y1)
ax1.set_ylabel('Y values for exp(-x)')
ax1.set_title("Double Y axis")

ax2 = ax1.twinx()  # this is the important function
ax2.plot(x, y2, 'r')
ax2.set_xlim([0, np.e])
ax2.set_ylabel('Y values for ln(x)')
ax2.set_xlabel('Same X for both exp(-x) and ln(x)')

plt.show()
绘制结果:


 2万+
2万+

 被折叠的 条评论
为什么被折叠?
被折叠的 条评论
为什么被折叠?
 到【灌水乐园】发言


