


网上找了好多博客,都不是很详细。摸爬滚打一上午,总结一下
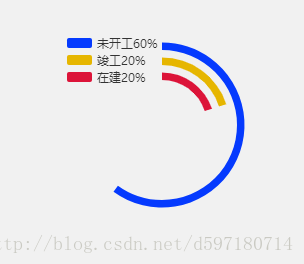
相当于series里三个饼图,radius:[100,220]第一个表示内径和外径 相差值就是环的大小,数据自己提前准备好放到legend 的 data 以及对应环的name
option = {
        tooltip: {
            show:false,//防止鼠标移到不需要的数据上弹出label
            trigger: 'item',
            formatter: "{a} : {c} ({d}%)"
        },
        color:['#dc1439','#e6b600','#053afe'],
         legend: {
            orient: 'vertical',
            x: '30%',
            top:'19%',
            itemHeight: 10,//图例的高度
            itemGap:5,//图例之间的间距
            data:['未开工'+preBuild+'%','竣工'+finishPercent+'%','在建'+inBuild+'%']//图例的名字需要和饼图的name一致,才会显示图例
        },
        series: [
            {
                name:'在建'+inBuild+'%',
                type:'pie',
                radius: ['35%', '30%'],//环的位置

                label: {
                    normal: {
                        position: 'inner'
                    }
                },
                labelLine: {
                    normal: {
                        show: false
                    }
                },
                data:[
                    {value:inBuildNum, //需要显示的数据
                    itemStyle: {
                                normal: {
                                 color: '#dc1439'
                                }
                     }},
                   {value:total-inBuildNum, //不需要显示的数据,颜色设置成和背景一样
                    itemStyle: {
                                normal: {
                                 color: 'transparent'
                                }
                     }}
                ]
            },
            {
                name:'竣工'+finishPercent+'%',
                type:'pie',
                radius: ['40%', '45%'],

                label: {
                    normal: {
                        position: 'inner'
                    }
                },
                labelLine: {
                    normal: {
                        show: false
                    }
                },
                data:[
                    {value:finishNum,
                    itemStyle: {
                                normal: {
                                 color: '#e6b600'
                                }
                     }},
                   {value:total-finishNum,
                    itemStyle: {
                                normal: {
                                 color: 'transparent'
                                }
                     },
                   }
                ]
            },
            {
                name:'未开工'+preBuild+'%',
                type:'pie',
                radius: ['55%', '50%'],

                label: {
                    normal: {
                        position: 'inner'
                    }
                },
                labelLine: {
                    normal: {
                        show: false
                    }
                },
                data:[
                    {value:preBuildNum,
                    itemStyle: {
                                normal: {
                                 color: '#053afe'
                                }
                     }},
                   {value:total-preBuildNum,
                    itemStyle: {
                                normal: {
                                 color: 'transparent'
                                }
                     }}
                ]
            },
        ]
    };


 2042
2042

 被折叠的 条评论
为什么被折叠?
被折叠的 条评论
为什么被折叠?
 到【灌水乐园】发言


