


摘要:
这一节我们介绍elasticsearch集群的配置
搭建环境:
vmware 12.X + ubuntu 16.04两台 + elasticsearch 5.5.1 + logstash 5.5.1
1、首先,我们修改elasticsearch文件夹下/config下的elasticsearch.yml文件
第1个节点:我们让它作为master节点,只负责管理,不存储数据
cluster.name: es-cluster-test
node.name: node-master
node.master: true
node.data: false
network.host: 10.45.32.103 ##第一台ubuntu的局域网ip
http.port: 9200
discovery.zen.ping.unicast.hosts: ["10.45.32.78", "10.45.32.103"]
discovery.zen.minimum_master_nodes: 1
第2个节点:我们让它作为data节点,不负责管理,只存储数据
cluster.name: es-cluster-test
node.name: node-data
node.master: false
node.data: true
network.host: 10.45.32.103 ##第一台ubuntu的局域网ip
http.port: 9200
discovery.zen.ping.unicast.hosts: ["10.45.32.78", "10.45.32.103"]
discovery.zen.minimum_master_nodes: 1
2、在两个ubuntu系统中分别运行elasticsearch
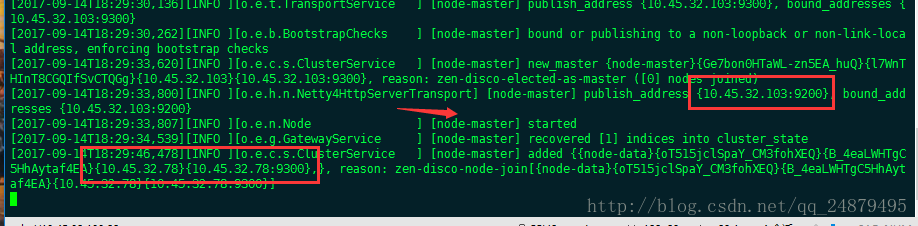
主节点运行成功
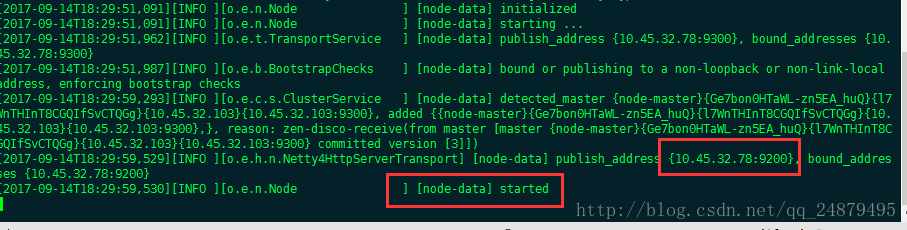
数据节点运行成功
到这里,elsticsearch集群已经搭建成功了,接下来我们测试一下
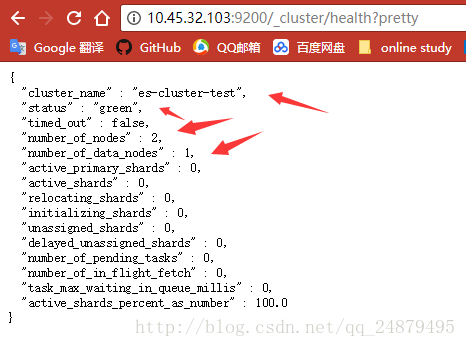
3、在外部windows中打开浏览器,分别访问两个elasticsearch
首先输入
http://10.45.32.103:9200/_cluster/health?pretty
结果为:
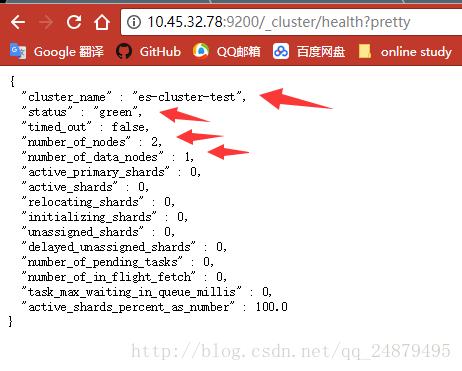
然后输入
http://10.45.32.78:9200/_cluster/health?pretty
4、然后我们在ip尾号为103的master节点上,运行logstash,配置文件依然为第6节中的配置文件,详见搭建ELK(ElasticSearch+Logstash+Kibana)日志分析系统(六) ElasticSearch demo演示
运行成功后输入elasticsearch cluster test
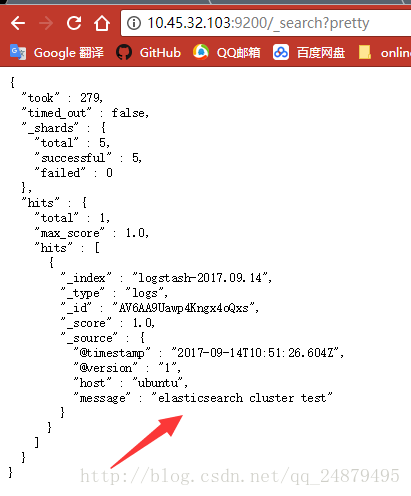
5、接着在外部windows中打开浏览器,分别访问两个elasticsearch
首先输入
http://10.45.32.103:9200/_search?pretty
结果为:
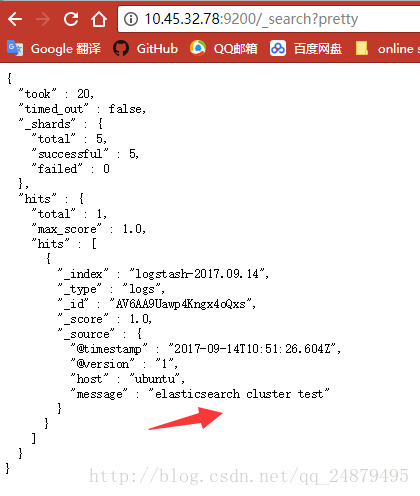
然后输入
http://10.45.32.78:9200/_search?pretty
结果为:
6、总结
在这个小集群当中,我们将10.45.32.78服务器上的elasticsearch设置为master节点,当时不存储数据;将10.45.32.103服务器上节点设置为数据节点。
集群跑起来之后,我们分别通过两个ip访问两个节点,得到的结果是一样的。
然后我们在78服务器上运行logstash,可以看到再次访问两个结点,都能看到输出的信息。
elk日志分析系统的强大,是不是开始体现出来了……


 1575
1575


 被折叠的 条评论
为什么被折叠?
被折叠的 条评论
为什么被折叠?
 到【灌水乐园】发言


