


学习了一段时间的数字图像处理,现在把我所做的分享出来和大家交流下,因为是用MATLAB GUI 做的,有些界面并未给出,如果你想直接复制运行可能出不来结果,
所以仅仅当作参考。
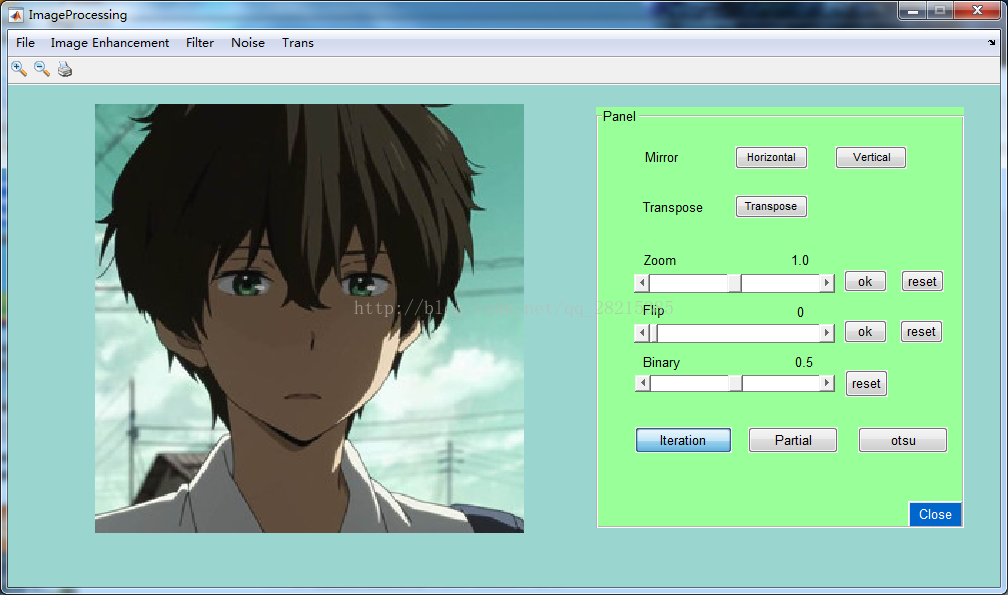
基本界面
% *******灰度化********************************************************

% --------------------------------------------------------------------
function gray_Callback(hObject, eventdata, handles)
% hObject    handle to gray (see GCBO)
% eventdata  reserved - to be defined in a future version of MATLAB
% handles    structure with handles and user data (see GUIDATA)
global im;
global map;
global gray;
global im_change;
im_change = 1;
axes(handles.axes1);
if isempty(im)
    warndlg('Please select a picture first!','Warning');
else
    if isempty(map)
        gray24(:,:,1) = im(:,:,1) * 0.299;
        gray24(:,:,2) = im(:,:,2) * 0.587;
        gray24(:,:,3) = im(:,:,3) * 0.114;
        gray = gray24(:,:,1)+gray24(:,:,2)+gray24(:,:,3);
        imshow(gray);
    else
        gray = ind2gray(im,map);
        imshow(gray);
    end;
    set(handles.pushbutton_reset,'visible','on');
end;
% ********直方图*********************************************************
function grayHist_Callback(hObject, eventdata, handles)
% hObject handle to grayHist (see GCBO)
% eventdata reserved - to be defined in a future version of MATLAB
% handles structure with handles and user data (see GUIDATA)
global gray;
figure('Name','histogram');
if isempty(gray)
warndlg('You must have a gray-scale first!','Warning');
else
i = gray;
subplot(2,2,1);
imhist(i);
title('灰度直方图');
subplot(2,2,2);
H = histeq(i);
imhist(H);
title('直方图均衡化');
subplot(2,2,3);
num1 = imhist(i);
[r1,c1] = size(i);
sum1 = r1*c1;
y = num1/sum1;
x = 0:255;
bar(x,y);
title('灰度直方图(%)');
subplot(2,2,4);
H = histeq(i);
num2 = imhist(H);
[r2,c2] = size(i);
sum2 = r2*c2;
Hy = num2/sum2;
bar(x,Hy);
title('直方图均衡化(%)');
figure('Name','histogram equalization');
imshow(H);
end;
% ********二值化********************************************************
function Binary_Callback(hObject, eventdata, handles)
% hObject handle to Binary (see GCBO)
% eventdata reserved - to be defined in a future version of MATLAB
% handles structure with handles and user data (see GUIDATA)
global gray;
global map;
global im_change;
im_change = 1;
i = gray;
axes(handles.axes1);
val = getappdata(handles.slider_binary,'Value');
if isempty(val)
val = 0.5;
end;
im2bw(i,val);
set(handles.slider_binary,'Enable','on');
set(handles.text_binary,'Enable','on');
% **********二值化阈值*****************************************************
% --- Executes on slider movement.
function slider_binary_Callback(hObject, eventdata, handles)
% hObject handle to slider_binary (see GCBO)
% eventdata reserved - to be defined in a future version of MATLAB
% handles structure with handles and user data (see GUIDATA)
% Hints: get(hObject,'Value') returns position of slider
% get(hObject,'Min') and get(hObject,'Max') to determine range of slider
val = get(hObject,'Value');
setappdata(handles.slider_binary,'Value',val);
set(handles.text_binary,'String',num2str(val));
Binary_Callback(hObject, eventdata, handles);
%handles=guidata(hObject);
% --- Executes during object creation, after setting all properties.
function slider_binary_CreateFcn(hObject, eventdata, handles)
% hObject handle to slider_binary (see GCBO)
% eventdata reserved - to be defined in a future version of MATLAB
% handles empty - handles not created until after all CreateFcns called
% Hint: slider controls usually have a light gray background.
if isequal(get(hObject,'BackgroundColor'), get(0,'defaultUicontrolBackgroundColor'))
set(hObject,'BackgroundColor',[.9 .9 .9]);
end
% --- Executes on button press in pushbutton_binary.
function pushbutton_binary_Callback(hObject, eventdata, handles)
% hObject handle to pushbutton_binary (see GCBO)
% eventdata reserved - to be defined in a future version of MATLAB
% handles structure with handles and user data (see GUIDATA)
val = 0.5;
set(handles.slider_binary,'Value',val);
setappdata(handles.slider_binary,'Value',val);
set(handles.text_binary,'String',num2str(val));
Binary_Callback(hObject, eventdata, handles);
% *********图像缩放********************************************************
% --- Executes on slider movement.
function slider_zoom_Callback(hObject, eventdata, handles)
% hObject handle to slider_zoom (see GCBO)
% eventdata reserved - to be defined in a future version of MATLAB
% handles structure with handles and user data (see GUIDATA)
% Hints: get(hObject,'Value') returns position of slider
% get(hObject,'Min') and get(hObject,'Max') to determine range of slider
val = get(hObject,'Value');
setappdata(handles.slider_zoom,'Value',val);
set(handles.text_zoom,'String',num2str(val));
% --- Executes during object creation, after setting all properties.
function slider_zoom_CreateFcn(hObject, eventdata, handles)
% hObject handle to slider_zoom (see GCBO)
% eventdata reserved - to be defined in a future version of MATLAB
% handles empty - handles not created until after all CreateFcns called
% Hint: slider controls usually have a light gray background.
if isequal(get(hObject,'BackgroundColor'), get(0,'defaultUicontrolBackgroundColor'))
set(hObject,'BackgroundColor',[.9 .9 .9]);
end
% --- Executes on button press in pushbutton_ok_zoom.
function pushbutton_ok_zoom_Callback(hObject, eventdata, handles)
% hObject handle to pushbutton_ok_zoom (see GCBO)
% eventdata reserved - to be defined in a future version of MATLAB
% handles structure with handles and user data (see GUIDATA)
val = getappdata(handles.slider_zoom,'Value');
img = getimage(handles.axes1);
im_re = imresize(img,val);
figure;
imshow(im_re);
% --- Executes on button press in pushbutton_reset_zoom.
function pushbutton_reset_zoom_Callback(hObject, eventdata, handles)
% hObject handle to pushbutton_reset_zoom (see GCBO)
% eventdata reserved - to be defined in a future version of MATLAB
% handles structure with handles and user data (see GUIDATA)
set(handles.slider_zoom,'Value',1.0);
setappdata(handles.slider_zoom,'Value',1.0);
set(handles.text_zoom,'String',num2str(1));
% *******图像翻转********************************************************
% --- Executes on slider movement.
function slider_flip_Callback(hObject, eventdata, handles)
% hObject handle to slider_flip (see GCBO)
% eventdata reserved - to be defined in a future version of MATLAB
% handles structure with handles and user data (see GUIDATA)
% Hints: get(hObject,'Value') returns position of slider
% get(hObject,'Min') and get(hObject,'Max') to determine range of slider
val = get(hObject,'Value');
setappdata(handles.slider_flip,'Value',val);
set(handles.text_flip,'String',num2str(val));
% --- Executes during object creation, after setting all properties.
function slider_flip_CreateFcn(hObject, eventdata, handles)
% hObject handle to slider_flip (see GCBO)
% eventdata reserved - to be defined in a future version of MATLAB
% handles empty - handles not created until after all CreateFcns called
% Hint: slider controls usually have a light gray background.
if isequal(get(hObject,'BackgroundColor'), get(0,'defaultUicontrolBackgroundColor'))
set(hObject,'BackgroundColor',[.9 .9 .9]);
end
% --- Executes on button press in pushbutton_ok_flip.
function pushbutton_ok_flip_Callback(hObject, eventdata, handles)
% hObject handle to pushbutton_ok_flip (see GCBO)
% eventdata reserved - to be defined in a future version of MATLAB
% handles structure with handles and user data (see GUIDATA)
global save_im;
global im_change;
axes(handles.axes1);
val = getappdata(handles.slider_flip,'Value');
img = getimage(handles.axes1);
if isempty(save_im) || im_change==1
save_im = img;
im_change = 0;
end;
im_ro = imrotate(img,val);
imshow(im_ro);
% --- Executes on button press in pushbutton_reset_flip.
function pushbutton_reset_flip_Callback(hObject, eventdata, handles)
% hObject handle to pushbutton_reset_flip (see GCBO)
% eventdata reserved - to be defined in a future version of MATLAB
% handles structure with handles and user data (see GUIDATA)
global save_im;
set(handles.slider_flip,'Value',0);
setappdata(handles.slider_flip,'Value',0);
set(handles.text_flip,'String',num2str(0));
axes(handles.axes1);
imshow(save_im);
% ******对比度调整********************************************************
function adjust_Callback(hObject, eventdata, handles)
% hObject handle to adjust (see GCBO)
% eventdata reserved - to be defined in a future version of MATLAB
% handles structure with handles and user data (see GUIDATA)
%将图像I中的亮度值映射到II中的新值
global gray;
j = imadjust(gray,[0 1],[1 0]);
figure;
set(gcf,'Name','adjust');
imshow(j,[]);
% ******对数变换********************************************************
function Logarithmic_Callback(hObject, eventdata, handles)
% hObject handle to Logarithmic (see GCBO)
% eventdata reserved - to be defined in a future version of MATLAB
% handles structure with handles and user data (see GUIDATA)
%img = getimage(handles.axes1);
global gray;
%l = logv+1(1+v*i);换底公式 l = log2(1 + v*i)/log2(v+1);
l = log(1+double(gray));
figure;
set(gcf,'Name','logarithmic');
imshow(l,[]);
% *******反转********************************************************
function reverse_Callback(hObject, eventdata, handles)
% hObject handle to reverse (see GCBO)
% eventdata reserved - to be defined in a future version of MATLAB
% handles structure with handles and user data (see GUIDATA)
img = getimage(handles.axes1);
s = 255-img;
figure('Name','reverse');
set(gcf,'Name','reverse');
imshow(s);
% ******幂次变换********************************************************
function exponent_trans_Callback(hObject, eventdata, handles)
% hObject handle to exponent_trans (see GCBO)
% eventdata reserved - to be defined in a future version of MATLAB
% handles structure with handles and user data (see GUIDATA)
global gray;
handles_power = guihandles(ImageProcessing);
dgray = double(gray);
s = getappdata(handles.edit_power,'String');
if isempty(s)
warndlg('Please enter power side!','Warning');
else
e = str2double(s);
j = dgray.^e;
figure('Name','exponent');
imshow(j,[]);
end;
% *******分段线性********************************************************
function Piecewise_linear_Callback(hObject, eventdata, handles)
% hObject handle to Piecewise_linear (see GCBO)
% eventdata reserved - to be defined in a future version of MATLAB
% handles structure with handles and user data (see GUIDATA)
global gray;
x0=0;y0=0; %对图像灰度进行分段的点
x1 = str2double(get(handles.edit_x1,'String'));
x2 = str2double(get(handles.edit_x2,'String'));
y1 = str2double(get(handles.edit_y1,'String'));
y2 = str2double(get(handles.edit_y2,'String'));
x3=255;y3=255;
if (x1<0||x1>255||x2<0||x2>255||y1<0||y1>255||y2<0||y2>255)
warndlg('Make sure the value entered is between 0 and 255!','Warning');
else
figure
plot([x0,x1,x2,x3],[y0,y1,y2,y3])
axis tight,xlabel('x'),ylabel('y')
title('intensitytransformation')%绘制变换曲线
k1=round(y1/x1);
b1=0;
k2=round((y2-y1)/(x2-x1));
b2=y1-k2*x1;
k3=round((y3-y2)/(x3-x2));
b3=y2-k3*x2;
[m,n]=size(gray);
X=double(gray);
for i=1:m
for j=1:n
x=X(i,j);
if ((x>=0)&&(x<x1))
y(i,j)=k1*x;
elseif ((x>=x1)&&(x<=x2))
y(i,j)=k2*x+b2;
elseif ((x>=x2)&&(x<=x3))
y(i,j)=k3*x+b3;
end
end
end
figure;
set(gcf,'Name','piecewise_linear');
y=mat2gray(y);
imshow(y);
end;
close(uipanel_piecewise_linear);
% *******滤波处理********************************************************
function Filter_Callback(hObject, eventdata, handles)
% hObject    handle to Filter (see GCBO)
% eventdata  reserved - to be defined in a future version of MATLAB
% handles    structure with handles and user data (see GUIDATA)


% *******锐化********************************************************
function sharpening_Callback(hObject, eventdata, handles)
% hObject    handle to sharpening (see GCBO)
% eventdata  reserved - to be defined in a future version of MATLAB
% handles    structure with handles and user data (see GUIDATA)


% --------roberts梯度算子(微分)-------------------------------------------
function roberts_Callback(hObject, eventdata, handles)
% hObject    handle to roberts (1see GCBO)
% eventdata  reserved - to be defined in a future version of MATLAB
% handles    structure with handles and user data (see GUIDATA)

global gray;
x=double(gray);
[m,n] = size(gray);
b=zeros(m,n,1);
c=zeros(m,n,1);
for i=1:m-2
    for j=1:n-2
        b(i+1,j+1)=x(i,j)-x(i+1,j+1);
        c(i+1,j+1)=x(i,j+1)-x(i+1,j);
        b(i+1,j+1)=sqrt(b(i+1,j+1)^2+c(i+1,j+1)^2);
    end
end
figure('Name','roberts');
imshow(uint8(b));


% -------sobel算子---------------------------------------------------------
function sobel_Callback(hObject, eventdata, handles)
% hObject    handle to sobel (see GCBO)
% eventdata  reserved - to be defined in a future version of MATLAB
% handles    structure with handles and user data (see GUIDATA)
global gray;
[m,n] = size(gray);
x=double(gray);
b=zeros(m,n);
c=zeros(m,n);
for i=1:m-2
    for j=1:n-2
        b(i+1,j+1)=x(i,j)+2*x(i+1,j)+x(i+2,j)-x(i,j+2)-2*x(i+1,j+2)-x(i+2,j+2);
        c(i+1,j+1)=-x(i,j)-2*x(i,j+1)-x(i,j+2)+x(i+2,j)+2*x(i+2,j+1)+x(i+2,j+2);
        b(i+1,j+1)=sqrt(b(i+1,j+1)^2+c(i+1,j+1)^2);
    end
end
figure('Name','sobel');
imshow(uint8(b));


% --------prewitt算子-------------------------------------------------------
function prewitt_Callback(hObject, eventdata, handles)
% hObject    handle to prewitt (see GCBO)
% eventdata  reserved - to be defined in a future version of MATLAB
% handles    structure with handles and user data (see GUIDATA)
global gray;
[m,n] = size(gray);
x=double(gray);
b=zeros(m,n);
c=zeros(m,n);
for i=1:m-2
    for j=1:n-2
        b(i+1,j+1)=-x(i,j)-x(i+1,j)-x(i+2,j)+x(i,j+2)+x(i+1,j+2)+x(i+2,j+2);
        c(i+1,j+1)=x(i,j)+x(i,j+1)+x(i,j+2)-x(i+2,j)-x(i+2,j+1)-x(i+2,j+2);
        b(i+1,j+1)=sqrt(b(i+1,j+1)^2+c(i+1,j+1)^2);
    end
end
figure('Name','prewitt');
imshow(uint8(b));

% --------拉普拉斯算子-----------------------------------------------------
function laplace_Callback(hObject, eventdata, handles)
% hObject    handle to laplace (see GCBO)
% eventdata  reserved - to be defined in a future version of MATLAB
% handles    structure with handles and user data (see GUIDATA)
img = getimage(handles.axes1);
w = fspecial('laplacian',0);
J = imfilter(img,w,'replicate');
figure('Name','laplace');
imshow(J);


% *******平滑********************************************************
function smoothing_Callback(hObject, eventdata, handles)
% hObject    handle to smoothing (see GCBO)
% eventdata  reserved - to be defined in a future version of MATLAB
% handles    structure with handles and user data (see GUIDATA)


% -------中值滤波-------------------------------------------------------
function median_filtering_Callback(hObject, eventdata, handles)
% hObject    handle to median_filtering (see GCBO)
% eventdata  reserved - to be defined in a future version of MATLAB
% handles    structure with handles and user data (see GUIDATA)
global im;
global gray;
global map;
if isempty(map)
J = imnoise(im,'salt & pepper',0.05);
else
J = imnoise(gray,'salt & pepper',0.05);
end;
val = get(handles.edit_val,'String');
n = str2num(val);
% M = medfilt2(J,[n n]);
[height, width]=size(J);
x1=double(J);
x2=x1;
for i=1:height-n+1
for j=1:width-n+1
c=x1(i:i+(n-1),j:j+(n-1));
e=c(:);%转换为行向量
% e=c(1,:);
% for u=2:n
% e=[e,c(u,:)];
% end
mm=median(e);
x2(i+(n-1)/2,j+(n-1)/2)=mm; %将模板各元素的中值赋给模板中心位置的元素
end
end
M = uint8(x2);
figure('Name','med_filter');
subplot(1,2,1);
imshow(J);
title('before filter');
subplot(1,2,2);
imshow(M);
title('after filter');
% -------均值滤波-------------------------------------------------------
function average_filter_Callback(hObject, eventdata, handles)
% hObject handle to average_filter (see GCBO)
% eventdata reserved - to be defined in a future version of MATLAB
% handles structure with handles and user data (see GUIDATA)
global gray;
J = imnoise(gray,'gaussian',0,0.01);
a = fspecial('average');
A = filter2(a,gray)/255;
figure('Name','average filter');
subplot(1,2,1);
imshow(J);
title('before filter');
subplot(1,2,2);
imshow(A);
title('after filter');% **********理想滤波*****************************************************
function ideal_Callback(hObject, eventdata, handles)
% hObject handle to ideal (see GCBO)
% eventdata reserved - to be defined in a future version of MATLAB
% handles structure with handles and user data (see GUIDATA)
% --------------------------------------------------------------------
function l_ideal_Callback(hObject, eventdata, handles)
% hObject handle to l_ideal (see GCBO)
% eventdata reserved - to be defined in a future version of MATLAB
% handles structure with handles and user data (see GUIDATA)
img = getimage(handles.axes1);
[M,N] = size(img);
P = 2*M;
Q = 2*N;
fc = zeros(M,N);
for x = 1:M
for y = 1:N
fc(x,y) = img(x,y) * (-1)^(x+y);
end
end
F = fft2(fc,P,Q);
H_1 = zeros(P,Q);
for x = (-P/2):1:(P/2)-1
for y = (-Q/2):1:(Q/2)-1
D = (x^2 + y^2)^(0.5);
if(D <= 120)
H_1(x+(P/2)+1,y+(Q/2)+1) = 1;
end
end
end
G = H_1 .* F;
g = real(ifft2(G));
g = g(1:M,1:N);
for x = 1:M
for y = 1:N
g(x,y) = g(x,y) * (-1)^(x+y);
end
end
figure;
subplot(1,2,1);
imshow(log(1 + abs(G)),[ ]);
subplot(1,2,2);
imshow(mat2gray(g));
% --------------------------------------------------------------------
function h_ideal_Callback(hObject, eventdata, handles)
% hObject handle to h_ideal (see GCBO)
% eventdata reserved - to be defined in a future version of MATLAB
% handles structure with handles and user data (see GUIDATA)
img = getimage(handles.axes1);
[M,N] = size(img);
P = 2*M;
Q = 2*N;
fc = zeros(M,N);
for x = 1:M
for y = 1:N
fc(x,y) = img(x,y) * (-1)^(x+y);
end
end
F = fft2(fc,P,Q);
H_1 = zeros(P,Q);
for x = (-P/2):1:(P/2)-1
for y = (-Q/2):1:(Q/2)-1
D = (x^2 + y^2)^(0.5);
if(D >= 120)
H_1(x+(P/2)+1,y+(Q/2)+1) = 1;
end
end
end
G = H_1 .* F;
g = real(ifft2(G));
g = g(1:M,1:N);
for x = 1:M
for y = 1:N
g(x,y) = g(x,y) * (-1)^(x+y);
end
end
figure;
subplot(1,2,1);
imshow(log(1 + abs(G)),[ ]);
subplot(1,2,2);
imshow(mat2gray(g));
% --------------------------------------------------------------------
function s_ideal_Callback(hObject, eventdata, handles)
% hObject handle to s_ideal (see GCBO)
% eventdata reserved - to be defined in a future version of MATLAB
% handles structure with handles and user data (see GUIDATA)
img = getimage(handles.axes1);
[M,N] = size(img);
P = 2*M;
Q = 2*N;
fc = zeros(M,N);
for x = 1:M
for y = 1:N
fc(x,y) = img(x,y) * (-1)^(x+y);
end
end
F = fft2(fc,P,Q);
H_1 = zeros(P,Q);
for x = (-P/2):1:(P/2)-1
for y = (-Q/2):1:(Q/2)-1
D = (x^2 + y^2)^(0.5);
D_0 = 250;
W = 50;
if(D < D_0-W/2 || D > D_0+W/2)
H_1(x+(P/2)+1,y+(Q/2)+1) = 1;
end;
end
end
G = H_1 .* F;
g = real(ifft2(G));
g = g(1:M,1:N);
for x = 1:M
for y = 1:N
g(x,y) = g(x,y) * (-1)^(x+y);
end
end
figure;
subplot(1,2,1);
imshow(log(1 + abs(G)),[ ]);
subplot(1,2,2);
imshow(mat2gray(g));
% --------------------------------------------------------------------
function p_ideal_Callback(hObject, eventdata, handles)
% hObject handle to p_ideal (see GCBO)
% eventdata reserved - to be defined in a future version of MATLAB
% handles structure with handles and user data (see GUIDATA)
img = getimage(handles.axes1);
[M,N] = size(img);
P = 2*M;
Q = 2*N;
fc = zeros(M,N);
for x = 1:M
for y = 1:N
fc(x,y) = img(x,y) * (-1)^(x+y);
end
end
F = fft2(fc,P,Q);
H_1 = zeros(P,Q);
for x = (-P/2):1:(P/2)-1
for y = (-Q/2):1:(Q/2)-1
D = (x^2 + y^2)^(0.5);
D_0 = 250;
W = 50;
if(D >= D_0-W/2 && D <= D_0+W/2)
H_1(x+(P/2)+1,y+(Q/2)+1) = 1;
end;
end
end
G = H_1 .* F;
g = real(ifft2(G));
g = g(1:M,1:N);
for x = 1:M
for y = 1:N
g(x,y) = g(x,y) * (-1)^(x+y);
end
end
figure;
subplot(1,2,1);
imshow(log(1 + abs(G)),[ ]);
subplot(1,2,2);
imshow(mat2gray(g));
% --------------------------------------------------------------------
function t_ideal_Callback(hObject, eventdata, handles)
% hObject handle to t_ideal (see GCBO)
% eventdata reserved - to be defined in a future version of MATLAB
% handles structure with handles and user data (see GUIDATA)
img = getimage(handles.axes1);
[M,N] = size(img);
P = 2*M;
Q = 2*N;
fc = zeros(M,N);
for x = 1:M
for y = 1:N
fc(x,y) = img(x,y) * (-1)^(x+y);
end
end
F = fft2(fc,P,Q);
H = ones(P,Q);
for x = (-P/2):1:(P/2)-1
for y = (-Q/2):1:(Q/2)-1
u_k=50;
v_k=70;
D0 = 20;
D1 = ((x+u_k)^2 + (y+v_k)^2)^(0.5);
D2 = ((x-u_k)^2 + (y-v_k)^2)^(0.5);
if(D1 <= D0 || D2 <= D0)
H(x+(P/2)+1,y+(Q/2)+1) = 0;
end;
end
end
G = H .* F;
g = real(ifft2(G));
g = g(1:M,1:N);
for x = 1:M
for y = 1:N
g(x,y) = g(x,y) * (-1)^(x+y);
end
end
figure;
subplot(1,2,1);
imshow(log(1 + abs(G)),[ ]);
subplot(1,2,2);
imshow(mat2gray(g));
% **********Butterworth滤波***********************************************
function butterworth_Callback(hObject, eventdata, handles)
% hObject handle to butterworth (see GCBO)
% eventdata reserved - to be defined in a future version of MATLAB
% handles structure with handles and user data (see GUIDATA)
% --------------------------------------------------------------------
function l_butterworth_Callback(hObject, eventdata, handles)
% hObject handle to l_butterworth (see GCBO)
% eventdata reserved - to be defined in a future version of MATLAB
% handles structure with handles and user data (see GUIDATA)
img = getimage(handles.axes1);
[M,N] = size(img);
P = 2*M;
Q = 2*N;
fc = zeros(M,N);
for x = 1:1:M
for y = 1:1:N
fc(x,y) = img(x,y) * (-1)^(x+y);
end
end
F = fft2(fc,P,Q);
H_1 = zeros(P,Q);
n = 1;%一阶
for x = (-P/2):(P/2)-1
for y = (-Q/2):(Q/2)-1
D = (x^2 + y^2)^(0.5);
D_0 = 100;
H_1(x+(P/2)+1,y+(Q/2)+1) = 1/(1+(D/D_0)^(2*n));
end
end
G = H_1 .* F;
g = real(ifft2(G));
g = g(1:M,1:N);
for x = 1:M
for y = 1:N
g(x,y) = g(x,y) * (-1)^(x+y);
end
end
figure;
subplot(1,2,1);
imshow(log(1 + abs(G)),[ ]);
subplot(1,2,2);
imshow(mat2gray(g));
% --------------------------------------------------------------------
function h_butterworth_Callback(hObject, eventdata, handles)
% hObject handle to h_butterworth (see GCBO)
% eventdata reserved - to be defined in a future version of MATLAB
% handles structure with handles and user data (see GUIDATA)
img = getimage(handles.axes1);
[M,N] = size(img);
P = 2*M;
Q = 2*N;
fc = zeros(M,N);
for x = 1:M
for y = 1:N
fc(x,y) = img(x,y) * (-1)^(x+y);
end
end
F = fft2(fc,P,Q);
H_1 = zeros(P,Q);
n = 1;
for x = (-P/2):1:(P/2)-1
for y = (-Q/2):1:(Q/2)-1
D = (x^2 + y^2)^(0.5);
D_0 = 100;
H_1(x+(P/2)+1,y+(Q/2)+1) = 1/(1+(D_0/D)^(2*n));
end
end
G = H_1 .* F;
g = real(ifft2(G));
g = g(1:M,1:N);
for x = 1:M
for y = 1:N
g(x,y) = g(x,y) * (-1)^(x+y);
end
end
figure;
subplot(1,2,1);
imshow(log(1 + abs(G)),[ ]);
subplot(1,2,2);
imshow(mat2gray(g));
% --------------------------------------------------------------------
function s_butterworth_Callback(hObject, eventdata, handles)
% hObject handle to s_butterworth (see GCBO)
% eventdata reserved - to be defined in a future version of MATLAB
% handles structure with handles and user data (see GUIDATA)
img = getimage(handles.axes1);
[M,N] = size(img);
P = 2*M;
Q = 2*N;
fc = zeros(M,N);
for x = 1:M
for y = 1:N
fc(x,y) = img(x,y) * (-1)^(x+y);
end
end
F = fft2(fc,P,Q);
H_1 = zeros(P,Q);
n = 1;
for x = (-P/2):1:(P/2)-1
for y = (-Q/2):1:(Q/2)-1
D = (x^2 + y^2)^(0.5);
D_0 = 250;
W = 30;
H_1(x+(P/2)+1,y+(Q/2)+1) = 1/(1+((D*W)/((D*D) - (D_0*D_0)))^(2*n));
end
end
G = H_1 .* F;
g = real(ifft2(G));
g = g(1:M,1:N);
for x = 1:M
for y = 1:N
g(x,y) = g(x,y) * (-1)^(x+y);
end
end
figure;
subplot(1,2,1);
imshow(log(1 + abs(G)),[ ]);
subplot(1,2,2);
imshow(mat2gray(g));
% --------------------------------------------------------------------
function p_butterworth_Callback(hObject, eventdata, handles)
% hObject handle to p_butterworth (see GCBO)
% eventdata reserved - to be defined in a future version of MATLAB
% handles structure with handles and user data (see GUIDATA)
img = getimage(handles.axes1);
[M,N] = size(img);
P = 2*M;
Q = 2*N;
fc = zeros(M,N);
for x = 1:M
for y = 1:N
fc(x,y) = img(x,y) * (-1)^(x+y);
end
end
F = fft2(fc,P,Q);
H_1 = zeros(P,Q);
n = 1;
for x = (-P/2):1:(P/2)-1
for y = (-Q/2):1:(Q/2)-1
D = (x^2 + y^2)^(0.5);
D_0 = 250;
W = 30;
H_1(x+(P/2)+1,y+(Q/2)+1) = 1 - 1/(1+((D*W)/((D*D) - (D_0*D_0)))^(2*n));
end
end
G = H_1 .* F;
g = real(ifft2(G));
g = g(1:M,1:N);
for x = 1:M
for y = 1:N
g(x,y) = g(x,y) * (-1)^(x+y);
end
end
figure;
subplot(1,2,1);
imshow(log(1 + abs(G)),[ ]);
subplot(1,2,2);
imshow(mat2gray(g));
% --------------------------------------------------------------------
function t_butterworth_Callback(hObject, eventdata, handles)
% hObject handle to t_butterworth (see GCBO)
% eventdata reserved - to be defined in a future version of MATLAB
% handles structure with handles and user data (see GUIDATA)
img = getimage(handles.axes1);
[M,N] = size(img);
P = 2*M;
Q = 2*N;
fc = zeros(M,N);
for x = 1:M
for y = 1:N
fc(x,y) = img(x,y) * (-1)^(x+y);
end
end
F = fft2(fc,P,Q);
H = ones(P,Q);
n=2;
for x = (-P/2):1:(P/2)-1
for y = (-Q/2):1:(Q/2)-1
D = 30;
u_k = 50;v_k = 70;
D_k = ((x+u_k)^2 + (y+v_k)^2)^(0.5);
H(x+(P/2)+1,y+(Q/2)+1) = H(x+(P/2)+1,y+(Q/2)+1) * 1/(1+(D/D_k)^(2*n));
D_k = ((x-u_k)^2 + (y-v_k)^2)^(0.5);
H(x+(P/2)+1,y+(Q/2)+1) = H(x+(P/2)+1,y+(Q/2)+1) * 1/(1+(D/D_k)^(2*n));
end
end
G = H .* F;
g = real(ifft2(G));
g = g(1:M,1:N);
for x = 1:M
for y = 1:N
g(x,y) = g(x,y) * (-1)^(x+y);
end
end
figure;
subplot(1,2,1);
imshow(log(1 + abs(G)),[ ]);
subplot(1,2,2);
imshow(mat2gray(g));
% **********高斯滤波***********************************************
function gaussian_Callback(hObject, eventdata, handles)
% hObject handle to gaussian (see GCBO)
% eventdata reserved - to be defined in a future version of MATLAB
% handles structure with handles and user data (see GUIDATA)
% --------------------------------------------------------------------
function l_gaussian_Callback(hObject, eventdata, handles)
% hObject handle to l_gaussian (see GCBO)
% eventdata reserved - to be defined in a future version of MATLAB
% handles structure with handles and user data (see GUIDATA)
img = getimage(handles.axes1);
[M,N] = size(img);
P = 2*M;
Q = 2*N;
fc = zeros(M,N);
for x = 1:1:M
for y = 1:1:N
fc(x,y) = img(x,y) * (-1)^(x+y);
end
end
F = fft2(fc,P,Q);
H_1 = zeros(P,Q);
H_2 = zeros(P,Q);
for x = (-P/2):1:(P/2)-1
for y = (-Q/2):1:(Q/2)-1
D = (x^2 + y^2)^(0.5);
D_0 = 60;
H_1(x+(P/2)+1,y+(Q/2)+1) = exp(-(D*D)/(2*D_0*D_0));
D_0 = 160;
H_2(x+(P/2)+1,y+(Q/2)+1) = exp(-(D*D)/(2*D_0*D_0));
end
end
G = H_1 .* F;
g = real(ifft2(G));
g = g(1:1:M,1:1:N);
for x = 1:M
for y = 1:N
g(x,y) = g(x,y) * (-1)^(x+y);
end
end
figure;
subplot(1,2,1);
imshow(log(1 + abs(G)),[ ]);
subplot(1,2,2);
imshow(mat2gray(g));
% --------------------------------------------------------------------
function h_gaussian_Callback(hObject, eventdata, handles)
% hObject handle to h_gaussian (see GCBO)
% eventdata reserved - to be defined in a future version of MATLAB
% handles structure with handles and user data (see GUIDATA)
img = getimage(handles.axes1);
[M,N] = size(img);
P = 2*M;
Q = 2*N;
fc = zeros(M,N);
for x = 1:M
for y = 1:N
fc(x,y) = img(x,y) * (-1)^(x+y);
end
end
F = fft2(fc,P,Q);
H_1 = zeros(P,Q);
for x = (-P/2):1:(P/2)-1
for y = (-Q/2):1:(Q/2)-1
D = (x^2 + y^2)^(0.5);
D_0 = 60;
H_1(x+(P/2)+1,y+(Q/2)+1) = 1 - exp(-(D*D)/(2*D_0*D_0));
end
end
G = H_1 .* F;
g = real(ifft2(G));
g = g(1:M,1:N);
for x = 1:M
for y = 1:N
g(x,y) = g(x,y) * (-1)^(x+y);
end
end
figure;
subplot(1,2,1);
imshow(log(1 + abs(G)),[ ]);
subplot(1,2,2);
imshow(mat2gray(g));
% --------------------------------------------------------------------
function s_gaussian_Callback(hObject, eventdata, handles)
% hObject handle to s_gaussian (see GCBO)
% eventdata reserved - to be defined in a future version of MATLAB
% handles structure with handles and user data (see GUIDATA)
img = getimage(handles.axes1);
[M,N] = size(img);
P = 2*M;
Q = 2*N;
fc = zeros(M,N);
for x = 1:M
for y = 1:N
fc(x,y) = img(x,y) * (-1)^(x+y);
end
end
F = fft2(fc,P,Q);
H_1 = zeros(P,Q);
n = 1;
for x = (-P/2):(P/2)-1
for y = (-Q/2):(Q/2)-1
D = (x^2 + y^2)^(0.5);
D_0 = 250;
W = 50;
H_1(x+(P/2)+1,y+(Q/2)+1) = 1 - exp(-((D*D-D_0*D_0)/(D*W))^2);
end
end
G = H_1 .* F;
g = real(ifft2(G));
g = g(1:M,1:N);
for x = 1:M
for y = 1:N
g(x,y) = g(x,y) * (-1)^(x+y);
end
end
figure;
subplot(1,2,1);
imshow(log(1 + abs(G)),[ ]);
subplot(1,2,2);
imshow(mat2gray(g));
% --------------------------------------------------------------------
function p_gaussian_Callback(hObject, eventdata, handles)
% hObject handle to p_gaussian (see GCBO)
% eventdata reserved - to be defined in a future version of MATLAB
% handles structure with handles and user data (see GUIDATA)
img = getimage(handles.axes1);
[M,N] = size(img);
P = 2*M;
Q = 2*N;
fc = zeros(M,N);
for x = 1:M
for y = 1:N
fc(x,y) = img(x,y) * (-1)^(x+y);
end
end
F = fft2(fc,P,Q);
H_1 = zeros(P,Q);
n = 1;
for x = (-P/2):(P/2)-1
for y = (-Q/2):(Q/2)-1
D = (x^2 + y^2)^(0.5);
D_0 = 250;
W = 50;
H_1(x+(P/2)+1,y+(Q/2)+1) = exp(-((D*D-D_0*D_0)/(D*W))^2);
end
end
G = H_1 .* F;
g = real(ifft2(G));
g = g(1:M,1:N);
for x = 1:M
for y = 1:N
g(x,y) = g(x,y) * (-1)^(x+y);
end
end
figure;
subplot(1,2,1);
imshow(log(1 + abs(G)),[ ]);
subplot(1,2,2);
imshow(mat2gray(g));
% --------------------------------------------------------------------
function t_gaussian_Callback(hObject, eventdata, handles)
% hObject handle to t_gaussian (see GCBO)
% eventdata reserved - to be defined in a future version of MATLAB
% handles structure with handles and user data (see GUIDATA)
img = getimage(handles.axes1);
[M,N] = size(img);
P = 2*M;
Q = 2*N;
fc = zeros(M,N);
for x = 1:M
for y = 1:N
fc(x,y) = img(x,y) * (-1)^(x+y);
end
end
F = fft2(fc,P,Q);
H = ones(P,Q);
for x = (-P/2):1:(P/2)-1
for y = (-Q/2):1:(Q/2)-1
D0=20;
u_k = 50;
v_k = 70;
D = ((x+u_k)^2 + (y+v_k)^2)^(0.5);
H(x+(P/2)+1,y+(Q/2)+1) = H(x+(P/2)+1,y+(Q/2)+1)*(1 - exp(-0.5*(D*D/D0^2)));
D = ((x-u_k)^2 + (y-v_k)^2)^(0.5);
H(x+(P/2)+1,y+(Q/2)+1) = H(x+(P/2)+1,y+(Q/2)+1)*(1 - exp(-0.5*(D*D/D0^2)));
end
end
G = H .* F;
g = real(ifft2(G));
g = g(1:M,1:N);
for x = 1:M
for y = 1:N
g(x,y) = g(x,y) * (-1)^(x+y);
end
end
figure;
subplot(1,2,1);
imshow(log(1 + abs(G)),[ ]);
subplot(1,2,2);
imshow(mat2gray(g));
% --------维纳滤波-------------------------------------------------------
function wiener_Callback(hObject, eventdata, handles)
% hObject handle to wiener (see GCBO)
% eventdata reserved - to be defined in a future version of MATLAB
% handles structure with handles and user data (see GUIDATA)
img=getimage(handles.axes1);
len=20;theta=30;
psf=fspecial('motion',len,theta);
I=im2double(img);
noise_var=0.0001;
estimated_nsr = noise_var / var(I(:));
f=deconvwnr(img, psf,estimated_nsr);
figure;
imshow(f);
% --------逆滤波----------------------------------------------------------
function inverse_Callback(hObject, eventdata, handles)
% hObject handle to inverse (see GCBO)
% eventdata reserved - to be defined in a future version of MATLAB
% handles structure with handles and user data (see GUIDATA)
img=getimage(handles.axes1);
len=20;theta=30;
psf=fspecial('motion',len,theta);
f=deconvwnr(img, psf, 0);
figure;
imshow(f);% ********添加噪声***************************************************
function add_noise_Callback(hObject, eventdata, handles)
% hObject handle to add_noise (see GCBO)
% eventdata reserved - to be defined in a future version of MATLAB
% handles structure with handles and user data (see GUIDATA)
% ---------椒盐噪声-------------------------------------------------------
function salt_pepper_Callback(hObject, eventdata, handles)
% hObject handle to salt_pepper (see GCBO)
% eventdata reserved - to be defined in a future version of MATLAB
% handles structure with handles and user data (see GUIDATA)
img = getimage(handles.axes1);
noise_gray = imnoise(img,'salt & pepper',0.05);
axes(handles.axes1);
imshow(noise_gray);
% --------高斯噪声---------------------------------------------------------
function gaussian_noise_Callback(hObject, eventdata, handles)
% hObject handle to gaussian_noise (see GCBO)
% eventdata reserved - to be defined in a future version of MATLAB
% handles structure with handles and user data (see GUIDATA)
img = getimage(handles.axes1);
noise_gray = imnoise(img,'gaussian',0,0.0001);
axes(handles.axes1);
imshow(noise_gray);
% ---------均匀噪声--------------------------------------------------------
function uniform_Callback(hObject, eventdata, handles)
% hObject handle to uniform (see GCBO)
% eventdata reserved - to be defined in a future version of MATLAB
% handles structure with handles and user data (see GUIDATA)
img = getimage(handles.axes1);
[M,N]=size(img);
a = 0;
b = 0.3;
n_Uniform = a + (b-a)*rand(M,N);
noise_gray = im2uint8(im2double(img) + n_Uniform);
axes(handles.axes1);
imshow(noise_gray);
% --------周期噪声------------------------------------------------------------
function periodic_noise_Callback(hObject, eventdata, handles)
% hObject handle to periodic_noise (see GCBO)
% eventdata reserved - to be defined in a future version of MATLAB
% handles structure with handles and user data (see GUIDATA)
img = getimage(handles.axes1);
[M,N] = size(img);
% I = img;
% for i=1:M
% for j=1:N
% I(i,j)=I(i,j)+10*sin(20*i)+10*sin(20*j);
% end
% end
I=im2double(img);
r=imnoise3(M,N,[50,50]);
I=I+r;
axes(handles.axes1);
imshow(I);
% ---------泊松噪声-------------------------------------------------------
function poisson_noise_Callback(hObject, eventdata, handles)
% hObject handle to poisson_noise (see GCBO)
% eventdata reserved - to be defined in a future version of MATLAB
% handles structure with handles and user data (see GUIDATA)
img = getimage(handles.axes1);
noise_gray = imnoise(img,'poisson');
axes(handles.axes1);
imshow(noise_gray);
% ---------瑞利噪声--------------------------------------------------------
function Rayleigh_Callback(hObject, eventdata, handles)
% hObject handle to Rayleigh (see GCBO)
% eventdata reserved - to be defined in a future version of MATLAB
% handles structure with handles and user data (see GUIDATA)
img = getimage(handles.axes1);
[M,N]=size(img);
a = -0.5;
b = 1;
n_rayleigh = a + (-b .* log(1 - rand(M,N))).^0.5;
noise_gray = im2uint8(im2double(img) + n_rayleigh);
axes(handles.axes1);
imshow(noise_gray);
% --------伽马噪声------------------------------------------------------------
function Erlang_Callback(hObject, eventdata, handles)
% hObject handle to Erlang (see GCBO)
% eventdata reserved - to be defined in a future version of MATLAB
% handles structure with handles and user data (see GUIDATA)
img = getimage(handles.axes1);
[M,N]=size(img);
a = 25;
b = 3;
n_Erlang = zeros(M,N);
for i=1:b
n_Erlang = n_Erlang + (-1/a)*log(1 - rand(M,N));
end
noise_gray = im2uint8(im2double(img) + n_Erlang);
axes(handles.axes1);
imshow(noise_gray);
% --------运动模糊---------------------------------------------------------
function motion_blur_Callback(hObject, eventdata, handles)
% hObject handle to motion_blur (see GCBO)
% eventdata reserved - to be defined in a future version of MATLAB
% handles structure with handles and user data (see GUIDATA)
img = getimage(handles.axes1);
len=20;theta=30;
psf=fspecial('motion',len,theta);
noise_gray=imfilter(im2double(img),psf,'conv','circular');
axes(handles.axes1);
imshow(noise_gray);
% *******重置图片********************************************************
% --- Executes on button press in pushbutton_reset.
function pushbutton_reset_Callback(hObject, ~, handles)
% hObject handle to pushbutton_reset (see GCBO)
% eventdata reserved - to be defined in a future version of MATLAB
% handles structure with handles and user data (see GUIDATA)
global gray;
global im;
axes(handles.axes1);
if isempty(gray)
imshow(im);
else
imshow(gray);
end;
% *******变化面板********************************************************
% --------------------------------------------------------------------
function Trans_Callback(hObject, eventdata, handles)
% hObject handle to Trans (see GCBO)
% eventdata reserved - to be defined in a future version of MATLAB
% handles structure with handles and user data (see GUIDATA)
function Transform_Callback(hObject, eventdata, handles)
% hObject handle to Transform (see GCBO)
% eventdata reserved - to be defined in a future version of MATLAB
% handles structure with handles and user data (see GUIDATA)
set(handles.uipanel1,'visible','on');
% --- Executes on button press in Close.
function Close_Callback(hObject, eventdata, handles)
% hObject handle to Close (see GCBO)
% eventdata reserved - to be defined in a future version of MATLAB
% handles structure with handles and user data (see GUIDATA)
set(handles.uipanel1,'visible','off');
% ---------水平镜像-------------------------------------------------------
% --- Executes on button press in pushbutton_horizontal.
function pushbutton_horizontal_Callback(hObject, eventdata, handles)
% hObject handle to pushbutton_horizontal (see GCBO)
% eventdata reserved - to be defined in a future version of MATLAB
% handles structure with handles and user data (see GUIDATA)
img=getimage(handles.axes1);
[r,c] = size(img);
result=zeros(r,c);
for i=1:r
for j=1:c
x = i;
y=c-j+1;
result(x,y)=img(i,j);
end;
end;
axes(handles.axes1);
imshow(uint8(result));
% ---------垂直镜像-------------------------------------------------------
% --- Executes on button press in pushbutton_vertical.
function pushbutton_vertical_Callback(hObject, eventdata, handles)
% hObject handle to pushbutton_vertical (see GCBO)
% eventdata reserved - to be defined in a future version of MATLAB
% handles structure with handles and user data (see GUIDATA)
img=getimage(handles.axes1);
[r,c] = size(img);
result=zeros(r,c);
for i=1:c
for j=1:r
x=r-j+1;
y = i;
result(x,y)=img(j,i);
end;
end;
axes(handles.axes1);
imshow(uint8(result));
% ---------转置-------------------------------------------------------
% --- Executes on button press in pushbutton_transpose.
function pushbutton_transpose_Callback(hObject, eventdata, handles)
% hObject handle to pushbutton_transpose (see GCBO)
% eventdata reserved - to be defined in a future version of MATLAB
% handles structure with handles and user data (see GUIDATA)
img=getimage(handles.axes1);
[r,c] = size(img);
result=zeros(r,c);
for i=1:c
for j=1:r
result(i,j)=img(j,i);
end;
end;
axes(handles.axes1);
imshow(uint8(result));
% **********伪彩色******************************************************
function pseudo_colour_Callback(hObject, eventdata, ~)
% hObject handle to pseudo_colour (see GCBO)
% eventdata reserved - to be defined in a future version of MATLAB
% handles structure with handles and user data (see GUIDATA)
global gray;
im=double(gray);
[m,n]=size(im);
L=256;
for i=1:m
for j=1:n
if im(i,j)<=L/5
R(i,j)=0;
G(i,j)=5*im(i,j);
B(i,j)=L;
else if im(i,j)<=L*2/5
R(i,j)=0;
G(i,j)=L;
B(i,j)=-5*im(i,j)+5/2*L;
else if im(i,j)<=3*L/5
R(i,j)=5*im(i,j)-4*L;
G(i,j)=L;
B(i,j)=0;
else if im(i,j)<=4*L/5
R(i,j)=5*im(i,j)-4*L;
G(i,j)=L;
B(i,j)=0;
else
R(i,j)=L;
G(i,j)=-5*im(i,j)+5*L;
B(i,j)=0;
end;
end
end
end
end
end
for i=1:m
for j=1:n
rgbim(i,j,1)=R(i,j);
rgbim(i,j,2)=G(i,j);
rgbim(i,j,3)=B(i,j);
end
end
rgbim=rgbim/256;
figure;
subplot(1,2,1);
imshow(gray);
subplot(1,2,2);
imshow(rgbim);% **********迭代法分割******************************************************
% --- Executes on button press in Iteration.
function Iteration_Callback(hObject, eventdata, handles)
% hObject handle to Iteration (see GCBO)
% eventdata reserved - to be defined in a future version of MATLAB
% handles structure with handles and user data (see GUIDATA)
I=getimage(handles.axes1);
f=im2double(I);
T=0.5*(min(f(:))+max(f(:)));
sign=false;
while ~sign
g=f>=T;
Tn=0.5*(mean(f(g))+mean(f(~g)));
sign=abs(T-Tn)<0.1;
T=Tn;
end;
T
figure;
imhist(f);
hold on;
plot([T,T],[0,1000],'r');
im=im2bw(f,T);
figure
imshow(im);
% **********局部分割******************************************************
% --- Executes on button press in Partial.
function Partial_Callback(hObject, eventdata, handles)
% hObject handle to Partial (see GCBO)
% eventdata reserved - to be defined in a future version of MATLAB
% handles structure with handles and user data (see GUIDATA)
I = getimage(handles.axes1);
background=imopen(I,strel('disk',15));
% Display the Background Approximation as a Surface
figure(2);surf(double(background(1:8:end,1:8:end))),zlim([0 255]);
title('background');set(gca,'ydir','reverse');
%Subtract the Backround Image from the Original Image
I2=imsubtract(I,background);
figure(1);subplot(221);imshow(I2);title('Remove the background');
%Increase the Image Contrast
I3=imadjust(I2);
figure(1);subplot(222);imshow(I3);title('Adjust the contrast');
level=graythresh(I3);
bw=im2bw(I3,level);
figure(1),subplot(223),imshow(bw);title('Binarized image');
[labeled,numObjects]=bwlabel(bw,4); % 4联通
RGB_label=label2rgb(labeled,'spring','c','shuffle');
figure(1),subplot(224),imshow(RGB_label);title('Final image');
% **********大津法分割******************************************************
% --- Executes on button press in otsu.
function otsu_Callback(hObject, eventdata, handles)
% hObject handle to otsu (see GCBO)
% eventdata reserved - to be defined in a future version of MATLAB
% handles structure with handles and user data (see GUIDATA)
I = getimage(handles.axes1);
Im=I;
I=double(I);
[m,n]=size(I);
Smax=-1;
for T=0:255
sum1=0;num1=0;
sum2=0;num2=0;
for i=1:m
for j=1:n
if I(i,j)>=T
sum2=sum2+I(i,j);
num2=num2+1;
else
sum1=sum1+I(i,j);
num1=num1+1;
end;
end;
end;
ave1=sum1/num1;
ave2=sum2/num2;
ave=(sum1+sum2)/(m*n);
d1=-1;d2=-1;
for i=1:m
for j=1:n
if I(i,j)>=T
d=(I(i,j)-ave2)^2;
if d2==-1
d2=d;
else
d2=d2+d;
end
else
d=(I(i,j)-ave1)^2;
if d1==-1
d1=d;
else
d1=d1+d;
end;
end
end
end
p1=num1/(m*n);
p2=num2/(m*n);
S1=p1*(ave1-ave)^2+p2*(ave2-ave)^2;
S2=p1*d1+p2*d2;
S=S1/S2;
if S>Smax
Smax=S;
Th=T;
end
end
Th
figure;
imhist(Im);
hold on;
plot([Th,Th],[0,1000],'r');
for i=1:m
for j=1:n
if I(i,j)>=Th
I(i,j)=255;
else
I(i,j)=0;
end
end
end
figure;
imshow(I);如有什么不妥之处还望不吝赐教!


 984
984


 被折叠的 条评论
为什么被折叠?
被折叠的 条评论
为什么被折叠?
 到【灌水乐园】发言


