


第15章 生成数据
15-1 立方:
import matplotlib.pyplot as plt

'''
x_values = [1, 2, 3, 4, 5]
y_values = [x**3 for x in x_values]

plt.scatter(x_values,y_values,s=100)
#plt.plot(x_values,y_values, linewidth=5)# 设置图表标题,并给坐标轴加上标签
plt.title("Cubic Numbers", fontsize=24)
plt.xlabel("Value", fontsize=14)
plt.ylabel("Cubic of Value", fontsize=14)# 设置刻度标记的大小

plt.tick_params(axis='both', which='major',labelsize=14)

plt.show()

'''

x_values = list(range(1,5001))
y_values = [x**3 for x in x_values]

plt.scatter(x_values,y_values,s=100)
#plt.plot(x_values,y_values, linewidth=5)# 设置图表标题,并给坐标轴加上标签
plt.title("Cubic Numbers", fontsize=24)
plt.xlabel("Value", fontsize=14)
plt.ylabel("Cubic of Value", fontsize=14)# 设置刻度标记的大小

plt.tick_params(axis='both', which='major',labelsize=14)

plt.show()
15-2 彩色立方
plt.scatter(x_values,y_values,c='red',cmap=plt.cm.Blues,
		edgecolor='none',s=10)
15-3 分子运动 + 15-4 改进的随机漫步
random_walk.py
from random import choice
class RandomWalk():
	def __init__(self, num_points=500):
		self.num_points = num_points
		self.x_values = [0]
		self.y_values = [0]

	def fill_walk(self):
		while len(self.x_values) < self.num_points:
			x_direction = choice([1, -1])
			x_distance = choice([0, 1, 2, 3, 4,5,6,7,8])
			x_step = x_direction * x_distance

			y_direction = choice([1, -1])
			y_distance = choice([0, 1, 2, 3, 4,5,6,7,8])
			y_step = y_direction * y_distance

			if x_step == 0 and y_step == 0:
				continue

			next_x = self.x_values[-1] + x_step
			next_y = self.y_values[-1] + y_step

			self.x_values.append(next_x)
			self.y_values.append(next_y)
rw_visual.py
import matplotlib.pyplot as plt

from random_walk import RandomWalk

rw = RandomWalk()
rw.fill_walk()

#plt.scatter(rw.x_values, rw.y_values, s=15)
plt.plot(rw.x_values, rw.y_values, linewidth=1)
plt.show()
(1),将x,y的方向删除 (只保留1,或 -1)

(2,),原始状态

15-5 重构
random_walk.py
关于类的函数,还要复习
from random import choice
class RandomWalk():
	def __init__(self, num_points=500):
		self.num_points = num_points
		self.x_values = [0]
		self.y_values = [0]

	def get_step(self):
		direction = choice([1,-1])
		distance = choice([0, 1, 2, 3, 4,5,6,7,8])
		step = direction * distance

		return step

	def fill_walk(self):
		while len(self.x_values) < self.num_points:
			x_step=self.get_step()#调用类中的函数,要用self.+函数名的形式
			y_step=self.get_step()

			if x_step == 0 and y_step == 0:
				continue

			next_x = self.x_values[-1] + x_step
			next_y = self.y_values[-1] + y_step

			self.x_values.append(next_x)
			self.y_values.append(next_y)
die.py:
from random import randint

class Die():
	"""表示一个骰子的类"""
	def __init__(self, num_sides=6):
		"""骰子默认为6面"""
		self.num_sides = num_sides
	def roll(self):
		""""返回一个位于1和骰子面数之间的随机值"""
		return randint(1, self.num_sides)
15-6 自动生成标签:
from die import Die
import pygal
# 创建一个D6
die_1 = Die()
die_2 = Die(10)
# 掷几次骰子,并将结果存储在一个列表中
results = []
for roll_num in range(100):
	result = die_1.roll()+die_2.roll()
	results.append(result)
frequencies=[]
max_result=die_1.num_sides+die_2.num_sides
for value in range(2, max_result+1):
	frequency = results.count(value)
	frequencies.append(frequency)


# 对结果进行可视化
hist = pygal.Bar()
hist.title = "Results of rolling one D6 1000 times."

#答案
x_values=list(range(1,20))
hist.x_labels = [x for x in x_values]

hist.x_title = "Result"
hist.y_title = "Frequency of Result"
hist.add('D6', frequencies)
hist.render_to_file('dice_visual.svg')
15-7 两个D8骰子:
以10的次方为量级:
掷骰子次数最大可达:100000次
15-8 同时掷三个骰子:
from die import Die
import pygal
# 创建一个D6
die_1 = Die(8)
die_2 = Die(8)
die_3 = Die(8)
# 掷几次骰子,并将结果存储在一个列表中
results = []
for roll_num in range(1000):
	result = die_1.roll()+die_2.roll()+die_3.roll()
	results.append(result)
frequencies=[]
max_result=die_1.num_sides+die_2.num_sides+die_3.num_sides
for value in range(2, max_result+1):
	frequency = results.count(value)
	frequencies.append(frequency)


# 对结果进行可视化
hist = pygal.Bar()
hist.title = "Results of rolling one D6 1000 times."
x_values=list(range(3,25))
hist.x_labels = [x for x in x_values]
hist.x_title = "Result"
hist.y_title = "Frequency of Result"
hist.add('D6', frequencies)
hist.render_to_file('dice_visual.svg')
15-9 略
15-10 练习使用本章介绍的两个库
第 16 章 下载数据
16.1 CSV文件格式
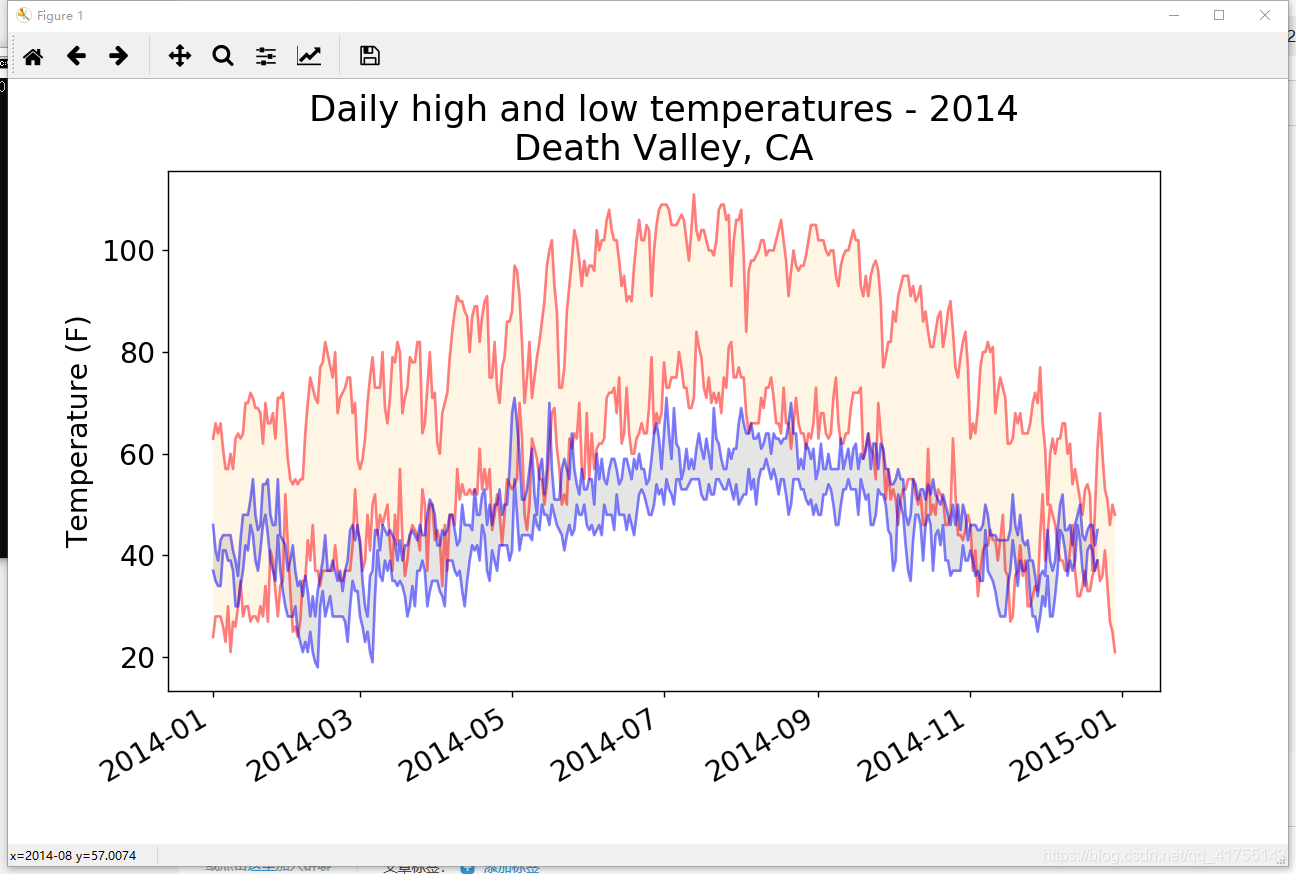
16-2 比较锡特卡和死亡谷的气温 :在有关锡特卡和死亡谷的图表中,气温刻度反映了数据范围的不同。为准确地比较锡特卡和死亡谷的气温范围,需要在y 轴上使用相同的刻度。为此,请修改图16-5和图16-6所示图表的y 轴设置,对锡特卡和死亡谷的气温范围进行直接比较(你也可以对任何两个地方的气温范围进行比较)。你还可以尝试在一个图表中呈现这两个数据集。
import csv
from datetime import datetime

from matplotlib import pyplot as plt

# Get dates, high, and low temperatures from file.
filename1 = 'death_valley_2014.csv'
filename2 = 'sitka_weather_2014.csv'

#死亡谷的数据记录
with open(filename1) as f:
    reader = csv.reader(f)
    header_row = next(reader)

    dates_d, highs_d, lows_d = [], [], []
    for row in reader:
        try:
            current_date = datetime.strptime(row[0], "%Y-%m-%d")
            high = int(row[1])
            low = int(row[3])
        except ValueError:
            print(current_date, 'missing data')
        else:
            dates_d.append(current_date)
            highs_d.append(high)
            lows_d.append(low)

with open(filename2) as f:
    reader = csv.reader(f)
    header_row = next(reader)

    dates_s, highs_s, lows_s = [], [], []
    for row in reader:
        try:
            current_date = datetime.strptime(row[0], "%Y-%m-%d")
            high = int(row[1])
            low = int(row[3])
        except ValueError:
            print(current_date, 'missing data')
        else:
            dates_s.append(current_date)
            highs_s.append(high)
            lows_s.append(low)


# Plot data.
fig = plt.figure(dpi=128, figsize=(10, 6))
plt.plot(dates_d, highs_d, c='red', alpha=0.5)
plt.plot(dates_d, lows_d, c='red', alpha=0.5)
plt.fill_between(dates_d, highs_d, lows_d, facecolor='orange', alpha=0.1)

#fig = plt.figure(dpi=128, figsize=(10, 6))
#加上上面这句,就会绘制两张图,去掉的话,只会绘制一张图
#
plt.plot(dates_s, highs_s, c='blue', alpha=0.5)
plt.plot(dates_s, lows_s, c='blue', alpha=0.5)
plt.fill_between(dates_s, highs_s, lows_s, facecolor='black', alpha=0.1)


# Format plot.
title = "Daily high and low temperatures - 2014\nDeath Valley, CA"
plt.title(title, fontsize=20)
plt.xlabel('', fontsize=16)
fig.autofmt_xdate()
plt.ylabel("Temperature (F)", fontsize=16)
plt.tick_params(axis='both', which='major', labelsize=16)

plt.show()
16-3 降雨量 :选择你感兴趣的任何地方,通过可视化将其降雨量呈现出来。为此,可先只涵盖一个月的数据,确定代码正确无误后,再使用一整年的数据来运行它。
注意:文件名,行数代表的数据意义,
16.2 制作世界人口地图:JSON格式
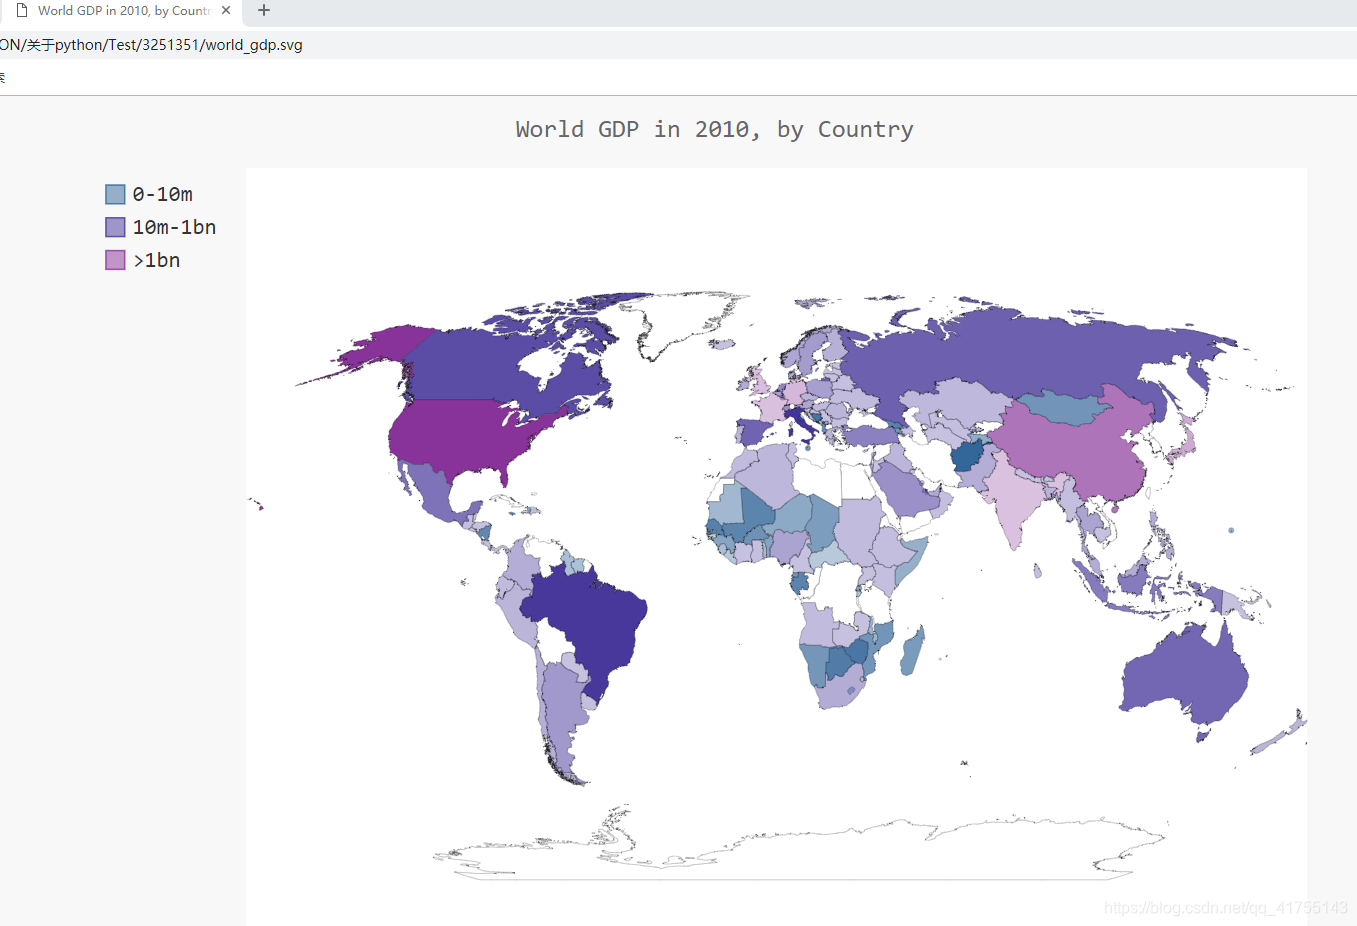
16-6 国内生产总值 :Open Knowledge Foundation提供了一个数据集,其中包含全球各国的国内生产总值(GDP),可在http://data.okfn.org/data/core/gdp/ 找到这个数据集。请下载这个数据集的JSON版本,并绘制一个图表,将全球各国最近一年的GDP呈现出来。
下载位置:
 貌似下载不了.json文件,只能打开网址:

只能写个爬虫把上面的内容保存为json格式,
import  requests
import json

url = 'https://pkgstore.datahub.io/core/gdp/gdp_csv/data/0048bc8f6228d0393d41cac4b663b90f/gdp_csv.csv'


reponse = requests.get(url)
print(type(reponse.text))
print(type(reponse.content))

with open('gdp_166.json','w') as f:
    f.write(reponse.text)
    f.close()
gdp.py:
import json
import pygal.maps.world
from country_codes import get_country_code#要把这个.py文件包含到该.py文件夹下
from pygal.style import RotateStyle
from pygal.style import LightColorizedStyle as LCS, RotateStyle as RS

filename = 'gdp_166.json'
cc_gdp={}
i=0
with open(filename,'r') as f:

	for line in f:
		if i==0:
			i+=1
			continue
#f为类型io...要遍历,不能直接输出
#其元素类型为str
#		print(line)
		proed=line.split(',')
		len1=len(proed)

		if len1==4 :#存在内容为'\n'的列表要排除
			country=proed[0]
			code = get_country_code(country)
			if proed[2]=='2016':#不能直接与数字2016相比啊
				if code:
					cc_gdp[code]=int(float(proed[3]))
				#print(proed[0]+' '+proed[3])

		i+=1
#US  18624475000000
#UK  2647898654635.24
#

cc_pops_1, cc_pops_2, cc_pops_3 = {}, {}, {}
for cc, pop in cc_gdp.items():

	if pop < 20000000000:#发展中国家
		cc_pops_1[cc] = pop
	elif pop < 2000000000000:#中等国家
		cc_pops_2[cc] = pop
	else:#发达国家
		cc_pops_3[cc] = pop
print(len(cc_pops_1), len(cc_pops_2), len(cc_pops_3))

# 看看每组分别包含多少个国家
print(len(cc_pops_1), len(cc_pops_2), len(cc_pops_3))

wm_style = RS('#336699', base_style=LCS)
wm = pygal.maps.world.World(style=wm_style)
wm.title = 'World GDP in 2010, by Country'
wm.add('0-10m', cc_pops_1)
wm.add('10m-1bn', cc_pops_2)
wm.add('>1bn', cc_pops_3)
wm.render_to_file('world_gdp.svg')
注意:要把country_codes.py文件写好并保存在该.py文件夹下。
效果图:
16-7 选择你自己的数据 :世界银行(The World Bank)提供了很多数据集,其中包含有关全球各国的信息。请访问http://data.worldbank.org/indicator/ ,并找到一个你感兴趣的数据集。单击该数据集,再单击链接Download Data并选择CSV。你将收到三个CSV文件,其中两个包含字样Metadata,你应使用第三个CSV文件。编写一个程序,生成一个字典,它将两个字母的Pygal国别码作为键,并将你从这个文件中选择的数据作为值。使用Worldmap 制作一个地图,在其中呈现这些数据,并根据你的喜好设置这个地图的样式。
我选取的是:forest Area,世界银行网站上有效果图

Forest_area_statics.csv是统计数据(我自己改了个名字),
读取csv文件,每一行是一个列表
allData=csv.reader(open('Forest_area_statics.csv','r',encoding='UTF-8')).csv文件内没有可视化的数据,所以不提取了(方法与上一题类似)
16-5,16-8不做了,没什么意思。


 1565
1565


 被折叠的 条评论
为什么被折叠?
被折叠的 条评论
为什么被折叠?
 到【灌水乐园】发言


