


 本文档提供了Oracle数据库的全面调优策略,包括诊断工具、会话统计、表扫描统计及共享池调整等内容。通过参数设置与工具使用指导,帮助读者理解和解决数据库性能问题。
1、Tuning Components
SQL> show parameter log_ch
NAME TYPE VALUE
------------------------------------ ----------- ------------------------------
log_checkpoint_interval integer 0
log_checkpoint_timeout integer 1800
log_checkpoints_to_alert boolean FALSE
SQL> alter system set log_checkpoints_to_alert= true scope=both;
SQL> alter session set sql_trace=true;
| SQL> select sid,serial#,username from v$session; SID SERIAL# USERNAME ---------- ---------- ------------------------------ 142 21 HR 145 2 147 2 153 7 155 1 156 1 158 71 159 3 SYS 160 1 161 1 162 1 163 1 164 1 165 1 166 1 167 1 168 1 169 1 170 1 19 rows selected. SQL> execute dbms_system.set_sql_trace_in_session(142,21,true); PL/SQL procedure successfully completed. SQL> SQL> show parameter sql_trace ---全局变量 |
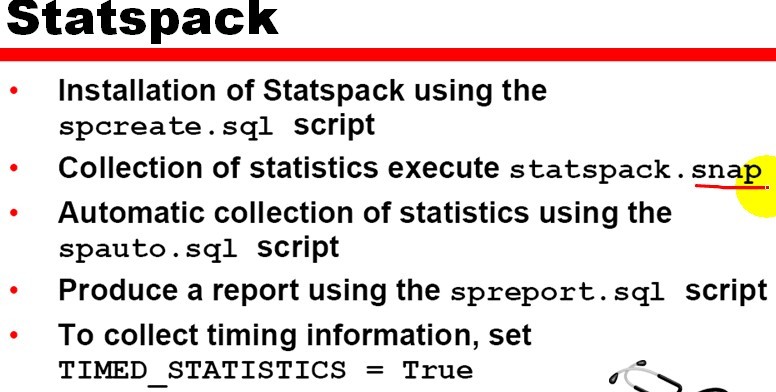
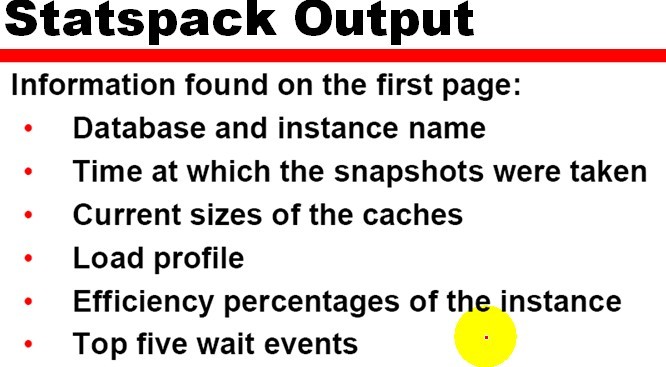
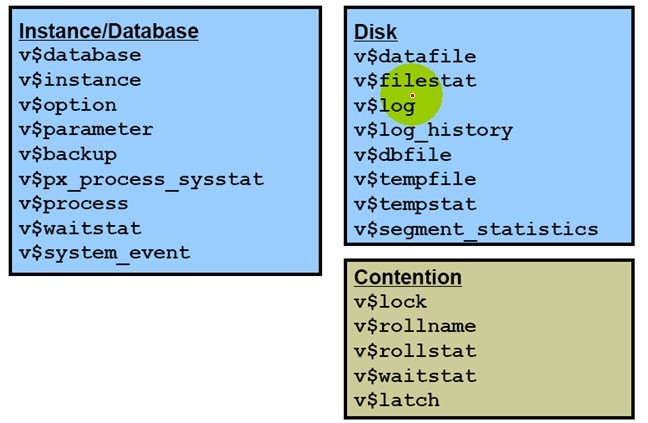
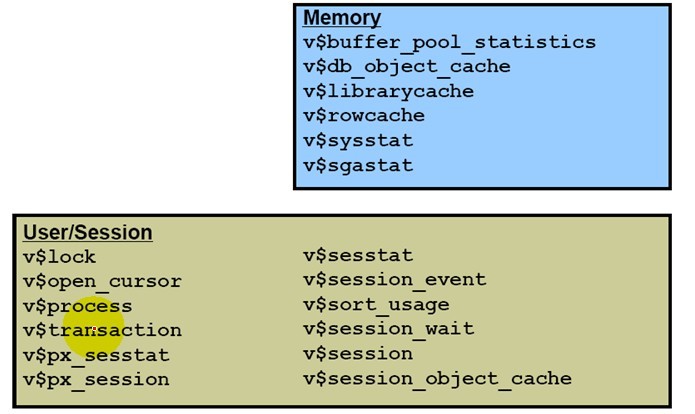
2、Views ,Utilities, and Tools

http://www.boobooke.com/v/bbk1269/
http://www.boobooke.com/v/bbk1270/
http://www.boobooke.com/v/bbk1271/
http://www.boobooke.com/v/bbk1272/
http://www.boobooke.com/v/bbk1279/
4、DD and Special Views
dba_tables,dba_tab_columns
dba_clusters
dba_index,index_stats
index_histogram,dba_tab_histograms
5、Syatemwide Statistics

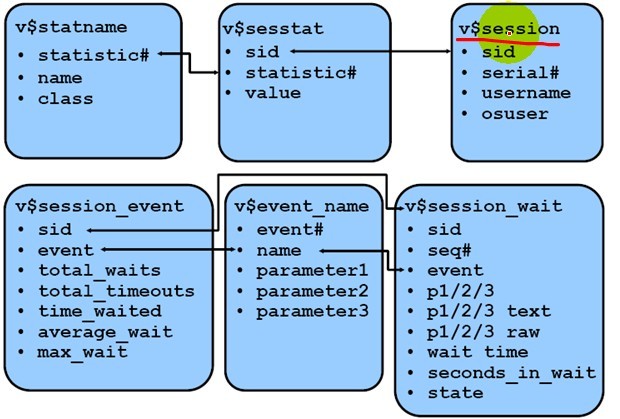
6、Session-Related Statistics
7、TS and Tuning Views
8、utlbstat & utlestat Script

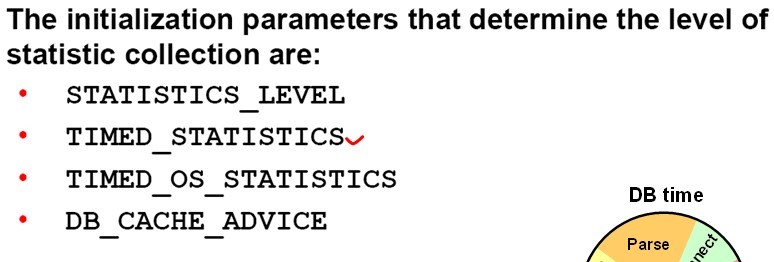
9、Level of Statics Collection
三、Database Configuration and IO Issues
1、Using v$filestat
select * from v$filestat;
select phyrds,phywrts,d.name
from v$filestat f,v$datafile d
where d.file# = f.FILE#
order by d.NAME;
2、Tuning FTS Operations
1)Configure theDB_FILE_MULTIBLOCK_READ_COUNT
2)v$session_longops
3、Table Scan statistics
select name,value from v$sysstat
where name like '%table scan%';
select sid,serial#,opname,to_char(start_time,'HH24:MI:SS') as "start",(sofar/totalwork)*100 as percent_complete
from v$session_longops;
4、Regulating Checkpoint Queue
initialization parameters
fast_start_io_target
log_checkpoint_interval
log_checkpoint_timeout
fast_start_mttr_target
fast start checkpointing
v$instance_recovery
5、Online Redo Configuration
v$logfile
v$log
v$log_history
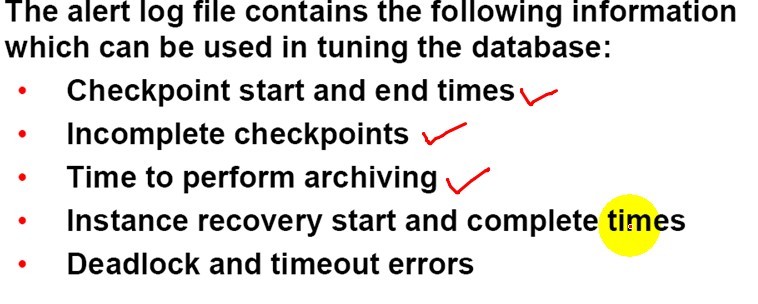
6、Diagnostic Tools
v$archive_dest
v$archived_log
v$archive_processes
log_archive_dest_state_n
四、Tuning the Shared Pool
1、Diagnostic Tools
--sgastat
--v$librarycache
SQL>select namespace,gets,gethits,pins,pinhits,reloads,invalidations from v$librarycache;
--v$sqlarea
SQL>select sql_text,parse_calls,executions from v$sqlarea order by parse_calls;
--v$sql
--v$sqltext
--v$db_object_cache
--v$sql_shared_cursor
Parameters affecting the components
shared_pool_size,open_cursors,session_cache_cursors,cursor_space_for_time
cursor_sharing,shared_pool_reserved_size
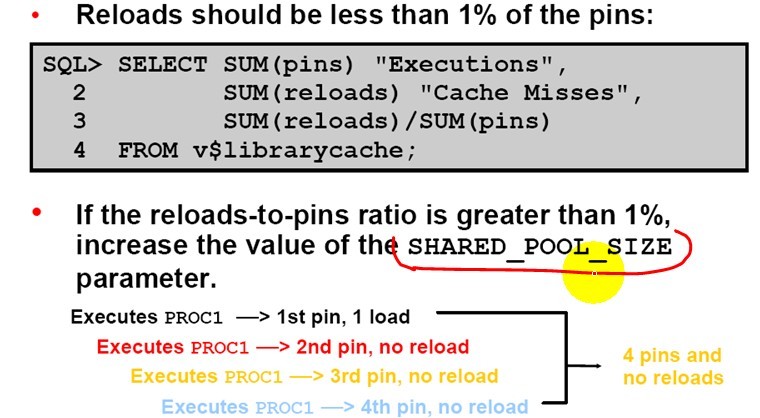
2、Library Cache Reloads
3、Shared Pool Advisory
select SHARED_POOL_SIZE_FOR_ESTIMATE as pool_size,ESTD_LC_SIZE,ESTD_LC_TIME_SAVED
from v$shared_pool_advice;
4、sql plan
select operation,object_owner,object_name,cost from v$sql_plan;
5、Global Space Allocation
select sum(sharable_mem) from v$db_object_cache;
select sum(sharable_mem) from v$sqlarea where executions>5;
6、Large Mem Requirements
show parameter shared_pool_reserved_size;
select * from v$shared_pool_reserved;
select free_space,requests,request_misses,request_failures from v$shared_pool_reserved;
Tuning SP Reserved Space

7、Keeping Large Objects
select * from v$db_object_cache
where sharable_mem>10000
and (type='PACKAGE' or type='PACKAGE BODY'
or type='FUNCTION' or type='PROCEDURE')
and kept='NO' ;
pin large packages in the library cache
execute dbms_shared_pool.keep('package_name');
8、Anonymous PL/SQL Blocks
select sql_text from v$sqlarea where command_type=47 and lenght(sql_text)>500;
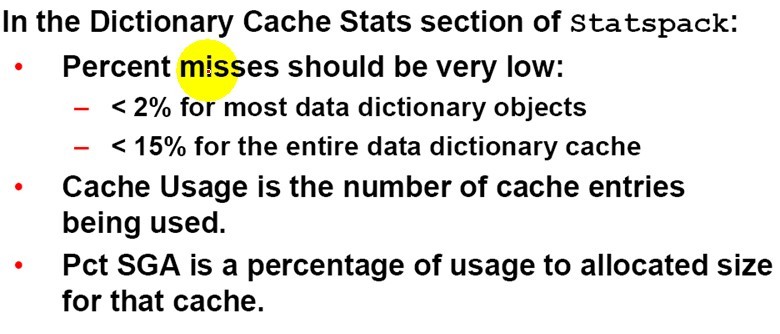
9、Tuning the Dictionary Cache
select parameter,gets,getmisses from v$rowcache;
Measuring the Statistics
SQL> select parameter,sum(gets),sum(getmisses),
100*sum(gets-getmisses)/sum(gets) pct_succ_gets,
sum(modifications) updates
from v$rowcache
where gets>0
group by parameter;


 275
275

 被折叠的 条评论
为什么被折叠?
被折叠的 条评论
为什么被折叠?
 到【灌水乐园】发言


