


Objectives
After completing this lesson, you should be able to do the following:
1.Identify key tuning components of the alert log file
2.Identify key runing components of background trace files
3.Identify key tuning components of user trace files
4.Colloect statistics with Oracle Entreprise Manager
5.Describe how Statspack collects statistics
6.Collect statistics with Statspack
7.Identiry dynamic performance wiews useful in tuning
8.Describe other tools used for tuning.
Maintenance of AlertLog
1.The alert log file consists of a chronological log of message and erros
2.Check the alert log file reqularly to :
a.Detect internal errors(ORA-600) and block corruption errors
b.Monitor database operations
c.View the nondefault initialization parameters
3.Remove or trim the file reqularly after checking
The alert log file contains the following information which can be used in tuning the database:
a.Checkpoint start and end times
b.Incomplete checkpoints
c.Time to perform archiving
d.Instance recovery start dn complete times
e.Deadlock and timeout errors
如果要使日志文件记录Checkpoint,则必须设置 LOG_CHECKPOINTS_TO_ALERT=true参数
Background Process Trace Files
1.The oracle server dumps information about errors detected by any background process into trace files.
2.Oracle Support uses these traces files to diagnose and troubleshot.
3.These files do not usually contain tuing information
background_dump_dest参数决定位置
User Trace Files
1.server process tracing can be enabled or disabled at session or instance level.
2.A user trace file contains statistics for traced SQL statements in that session.
3.User trace files are created on a per server process basis.
4.User trace files can also be created by
1.Backup cotrol file to trace
2.Database set EVENTS
SQL> conn usr1/usr1
SQL> alter session set sql_trace=true;                                                          SQL> select * from ta;
        ID NAME
---------- ----------
         1 wwww
         0 wdwwdw

oracle@localhost udump]$ pwd
/u01/app/oracle/admin/king/udump
[oracle@localhost udump]$ ls
king_ora_5338.trc

oracle    5338  0.0  1.7 376184 17824 ?        Ss   17:57   0:00 oracleking (DESCRIPTION=(LOCAL=YES)(ADDRESS=(PROTOCOL=beq)))

5338 dedicate的process ID

使其他session产生 trace

SQL> conn / as sysdba
SQL> select sid,serial#,username from v$session;

       SID    SERIAL# USERNAME
---------- ---------- ------------------------------
       139          1
       144          4
       145         14 USR1
       150          1

SQL> EXECUTE dbms_system.set_sql_trace_in_session(145,14,TRUE);


还有一个全局参数控制SQL_TRACE, 这个值一般设置为false,开了影响性能
SQL> show parameter sql_trace;
NAME                                 TYPE        VALUE
------------------------------------ ----------- ------------------------------
sql_trace                            boolean     TRUE
Views , Utilities and Tools
1.Oracle Enterprise Manager
2.Diagnostics and tuning packs
3.Statspack
4.v$xxx dynamic troubleshooting and performance views
5.dba_xxx dictionary views
6.Oracle wait evnets
7.utlbstat.sql and utlestat.sql scripts
Statspack
1.installation of Statspack using the spcreate.sql script
2.Collection of statistics execute statspack.snap
3.Automatic collection of statistics using the spauto.sql script
4.Produce a report using the spreport.sql script
5.To collect timing information , set TIMED_STATISTICS=True;
SQL> create tablespace perfstat DATAFILE '/u01/app/oracle/oradata/king/backup/perfstat_01.dbf' SIZE 512M;

Tablespace created.

SQL> @?/rdbms/admin/spcreate.sql     --安装stat

SQL> execute statspack .snap;      --手工执行快照  一般两次之间不要超过 10分钟,不要跨越停机时间

SQL> @?/rdbms/admin/spreport

产生的文件如下:
SQL> !
[oracle@localhost ~]$ ls
Desktop  sp_1_11.lst  spcpkg.lis  spctab.lis  spcusr.lis
Statspack Output
1.Database and instance name
2.Time at which the snapshosts were taken
3.Current sizesof the caches
4.Load profile
5.Efficiency percentages of the instance
6.Top five wait events
7.Rollbac or undo segment statistics
8.Latch activity
9.Dictionary cache statistics
10.Libarary cache statistics
11.System Global Area(SGA)statics
12 Startup values for initialization parameters
DD and Special Views
The following dictionary and special vews provide useful statistics after using the dbms_stats package:
1.DBA_TABLES,DBA_TAB_COLUMNS
2.DBA_CLUSTERS
3.DBA_INDEXES, INDEX_STATS
4.INDEX_HISTOGRAM,DBA_TAB_HISTOGRAMS
This statisticcal information is static until you reexecute dbms_stats;
Systemwide Statistics
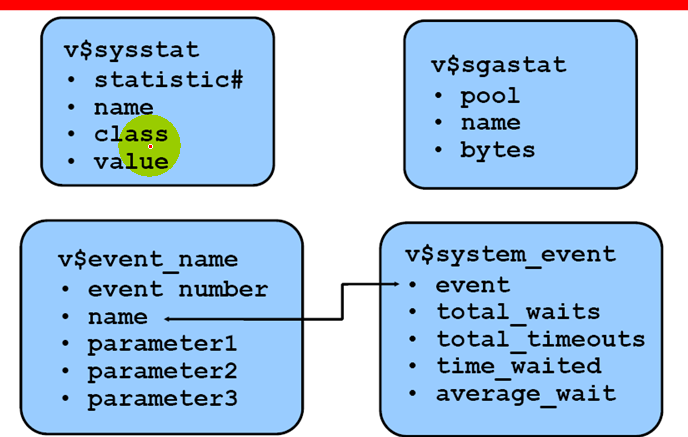
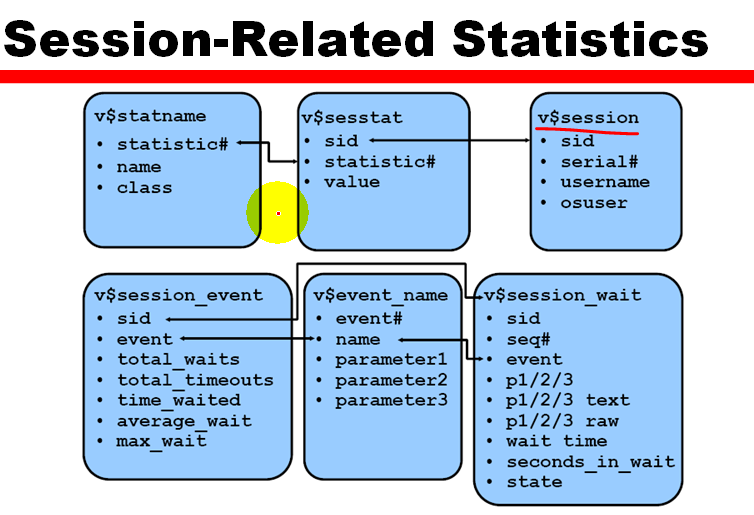
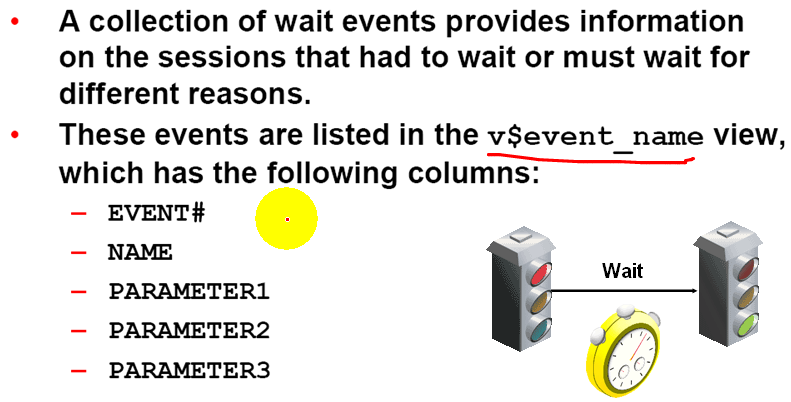
Oracle Wait Events
Statistics Event Views
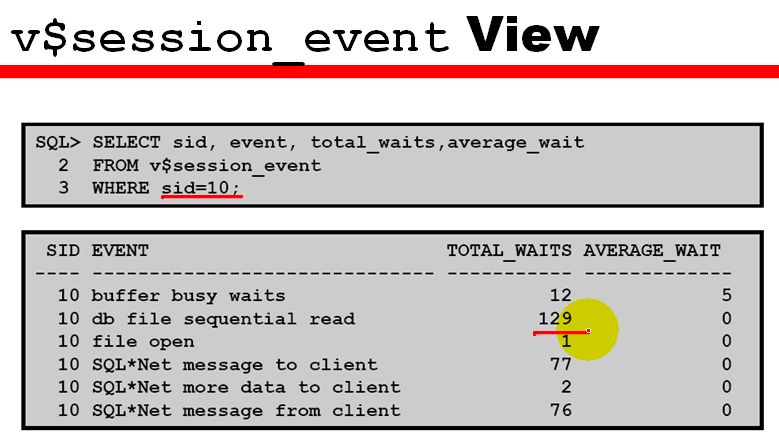
1.V$session_event: Waits for an event for each session that had to wait;
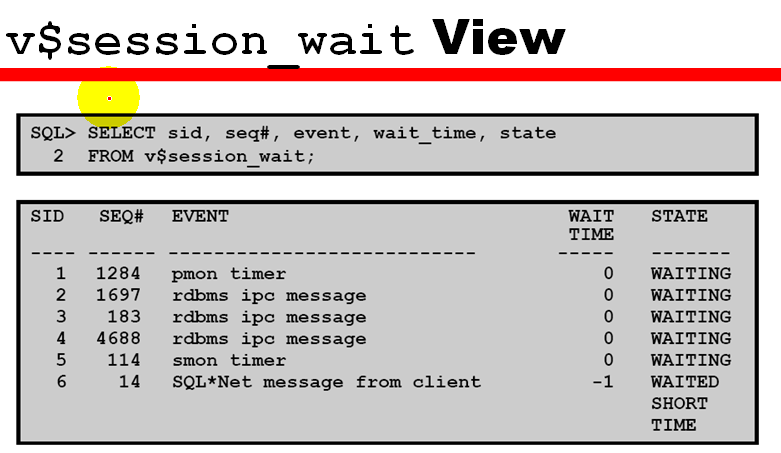
2.V$session_wait: Waits for an event for current active sessions that are waiting
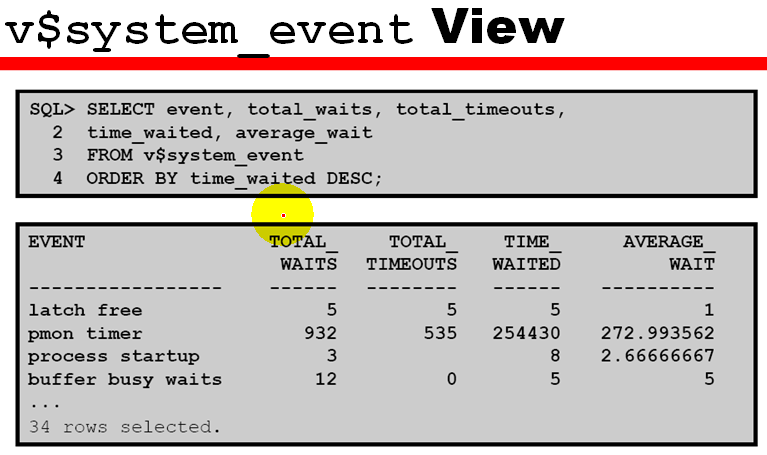
3.V$system_event: Total waits for an event, all sessions together
Specail Vies
1.V$ views:
a.Based on X$tables;
b.Listed in v$fixed_table
2.X$ tables;
a.Not usually queried directly
b.Dynamic and constantly changing
c.Names abbreviated and obscure
3.Populated at startup and cleared at shutdown
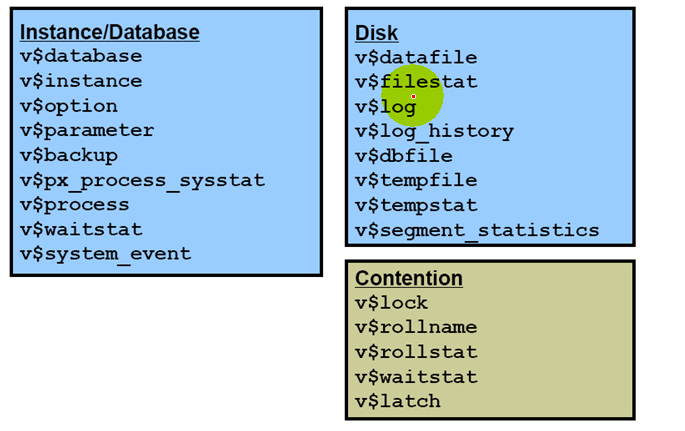
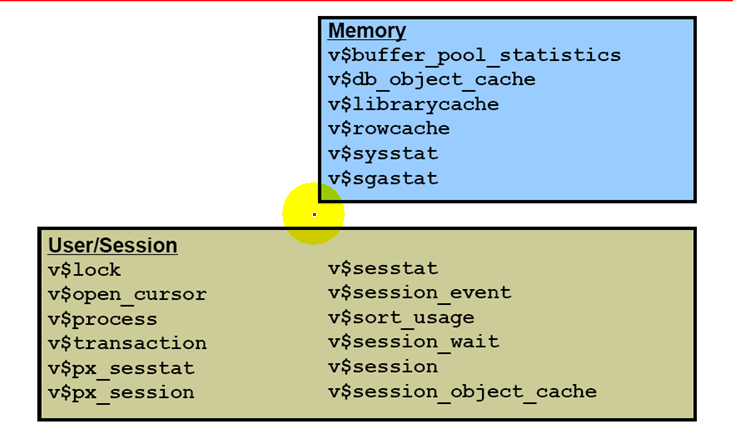
Trouble Shoot and Tuning Views:
DBA-Developed Tools
1.Develop your own scripts
2.Use the supplied packages for tuning.
3.Schedule periodic performance checking
4.Take advantage of the enterprise Manager Event service to track specific situation
5.Take advantae of the Oracle Enterprise Manager Job service to :
a.Automate the reqular execution of administrative tasks
b.Apply tasks that automatically solve problems detected by the Oracle Enterprise Manager event service.\
Level of Statics Collection
The initialization parameters that determine the level of statistic collection are:
1.STATISTICS_LEVEL: 搜集的级别 默认的设置为TYPICAL . {ALL|TYPICAL|BASIC}
2.TIMED_STATISTICS: {true|false}
3.TIMED_OS_STATISTICS:
4.DB_CACHE_ADVICE: {ON|READY|OFF} 收集和cache大小决定


 205
205


 被折叠的 条评论
为什么被折叠?
被折叠的 条评论
为什么被折叠?
 到【灌水乐园】发言


