


1. Rect01.svg文件
用到d3.xml函数,第一个参数是地址,第二个参数是个回调函数
<?xml version="1.0" standalone="no"?>
<!DOCTYPE svg PUBLIC "-//W3C//DTD SVG 1.1//EN"
"http://www.w3.org/Graphics/SVG/1.1/DTD/svg11.dtd">
<svg width="12cm" height="4cm" viewBox="200 200 1200 400"
xmlns="http://www.w3.org/2000/svg" version="1.1">
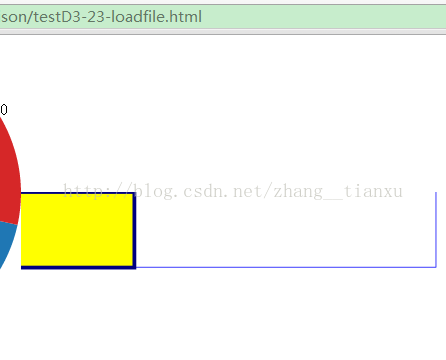
<desc>Example rect01 - rectangle with sharp corners</desc>
<rect x="100" y="1" width="1198" height="398"
fill="none" stroke="blue" stroke-width="2"/>
<rect x="100" y="200" width="400" height="200"
fill="yellow" stroke="navy" stroke-width="10" />
</svg>
2. 加载SVG
d3.xml("http://localhost:8080/spring/D3data/Rect01.svg", "image/svg+xml", //加载文件
function(xml) {
   document.body.appendChild(xml.documentElement);//添加DOM节点
});


 1989
1989

 被折叠的 条评论
为什么被折叠?
被折叠的 条评论
为什么被折叠?
 到【灌水乐园】发言


