


<!DOCTYPE html>
<html lang="en">
<head>
<meta charset="utf-8" />
<title>ECharts-基本线性图及其配置要求</title>
<script src="js/esl.js" type="text/javascript"></script>
</head>
<body>
<div id="main" style="height: 400px; border: 1px solid #ccc; padding: 10px;">
</div>
<script type="text/javascript" language="javascript">
// 按需加载
// Step:3 conifg ECharts's path, link to echarts.js from current page.
// Step:3 为模块加载器配置echarts的路径,从当前页面链接到echarts.js,定义所需图表路径
require.config({
paths: {
echarts: './js/echarts' //echarts.js的路径
}
});
// Step:4 require echarts and use it in the callback.
// Step:4 动态加载echarts然后在回调函数中开始使用,注意保持按需加载结构定义图表路径
require(
[
'echarts',
'echarts/chart/line'
],
//回调函数
DrawEChart
);
//渲染ECharts图表
function DrawEChart(ec) {
//图表渲染的容器对象
var chartContainer = document.getElementById("main");
//加载图表
var myChart = ec.init(chartContainer);
myChart.setOption({
//图表标题
title: {
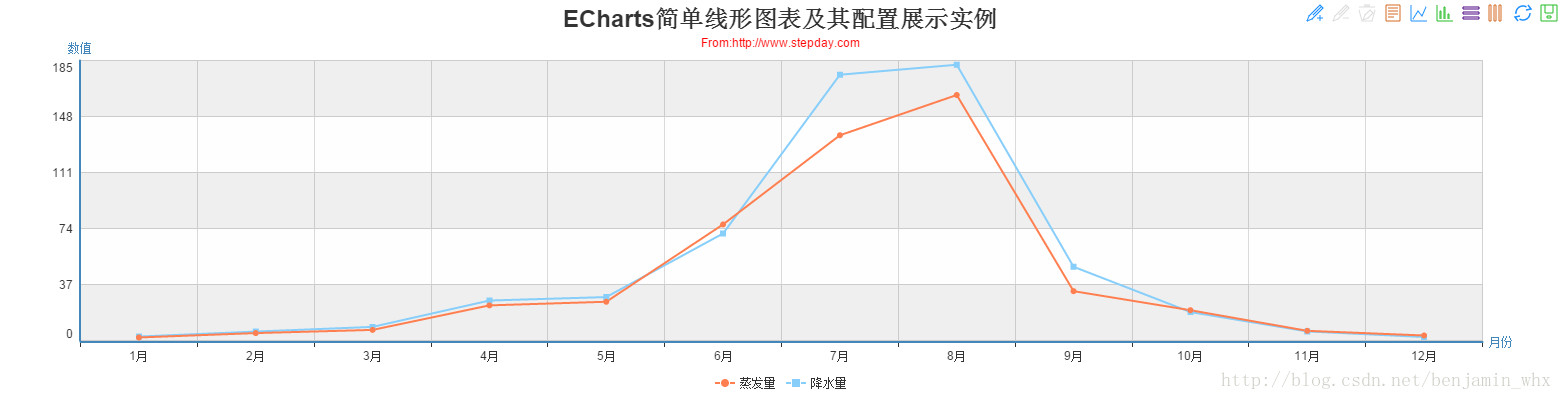
text: "ECharts简单线形图表及其配置展示实例", //正标题
link: "http://www.stepday.com", //正标题链接 点击可在新窗口中打开
x: "center", //标题水平方向位置
subtext: "From:http://www.stepday.com", //副标题
sublink: "http://www.stepday.com", //副标题链接
//正标题样式
textStyle: {
fontSize:24
},
//副标题样式
subtextStyle: {
fontSize:12,
color:"red"
}
},
//数据提示框配置
tooltip: {
trigger: 'axis' //触发类型,默认数据触发,见下图,可选为:'item' | 'axis' 其实就是是否共享提示框
},
//图例配置
legend: {
data: ['蒸发量', '降水量'], //这里需要与series内的每一组数据的name值保持一致
y:"bottom"
},
//工具箱配置
toolbox: {
show : true,
feature : {
mark : {show: true}, // 辅助线标志,上图icon左数1/2/3,分别是启用,删除上一条,删除全部
dataView : {show: true, readOnly: false},// 数据视图,上图icon左数8,打开数据视图
magicType : {show: true, type: ['line', 'bar', 'stack', 'tiled']},// 图表类型切换,当前仅支持直角系下的折线图、柱状图转换,上图icon左数6/7,分别是切换折线图,切换柱形图
restore : {show: true}, // 还原,复位原始图表,上图icon左数9,还原
saveAsImage : {show: true} // 保存为图片,上图icon左数10,保存
}
},
calculable: true,
//轴配置
xAxis: [
{
type: 'category',
data: ['1月', '2月', '3月', '4月', '5月', '6月', '7月', '8月', '9月', '10月', '11月', '12月'],
name: "月份"
}
],
//Y轴配置
yAxis: [
{
type: 'value',
splitArea: { show: true },
name:"数值"
}
],
//图表Series数据序列配置
series: [
{
name: '蒸发量',
type: 'line',
data: [2.0, 4.9, 7.0, 23.2, 25.6, 76.7, 135.6, 162.2, 32.6, 20.0, 6.4, 3.3]
},
{
name: '降水量',
type: 'line',
data: [2.6, 5.9, 9.0, 26.4, 28.7, 70.7, 175.6, 182.2, 48.7, 18.8, 6.0, 2.3]
}
]
});
}
</script>
</body>
</html>


 4012
4012


 被折叠的 条评论
为什么被折叠?
被折叠的 条评论
为什么被折叠?
 到【灌水乐园】发言


