


TempoChartActivity是hellocharts-android库的折线图之一 由于没有文档,需要详细阅读代码来达到修改的目的
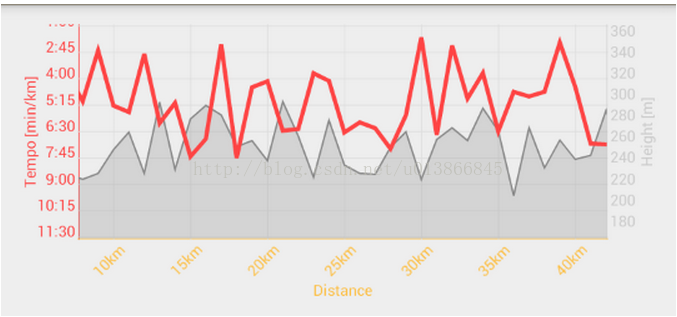
修改后
1、取消第一个折线
注释掉activity的88-106行代码
  // Tempo line is a little tricky because worse tempo means bigger value for example 11min per km is worse
            // than 2min per km but the second should be higher on the chart. So you need to know max tempo and
            // tempoRange and set
            // chart values to minTempo - realTempo.
//            values = new ArrayList<PointValue>();
//            for (int i = 0; i < numValues; ++i) {
//                // Some random raw tempo values.
//                float realTempo = (float) Math.random() * 6 + 2;
//                float revertedTempo = tempoRange - realTempo;
//                values.add(new PointValue(i, revertedTempo));
//            }

//            line = new Line(values);
//            line.setColor(ChartUtils.COLOR_RED);
//            line.setHasPoints(false);
//            line.setStrokeWidth(3);
//            lines.add(line);

            // Data and axes
data = new LineChartData(lines);
------------------------------------------------------
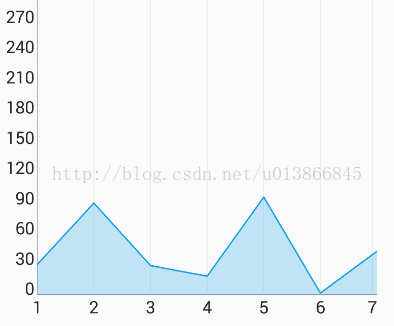
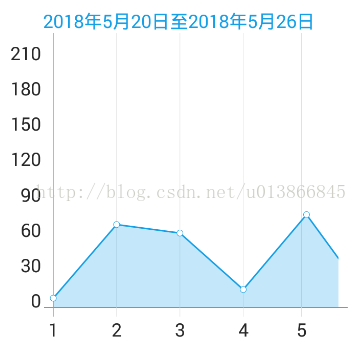
2、横坐标的数字旋转,得到如图的数字
需要修改activity的66行代码int numValues = 7;需要注释掉AxesRenderer的612、613行代码if (axis.hasTiltedLabels()) { canvas.save(); // canvas.translate(tiltedLabelXTranslation[position], tiltedLabelYTranslation[position]); // canvas.rotate(-45, labelX, labelY); canvas.drawText(labelBuffer, labelBuffer.length - charsNumber, charsNumber, labelX, labelY, labelPaintTab[position]); canvas.restore(); } else { canvas.drawText(labelBuffer, labelBuffer.length - charsNumber, charsNumber, labelX, labelY, labelPaintTab[position]); }这个时候会出现一个问题,最后数字7部分显示不全解决办法:在AxesRenderer的494行下面这段代码---------------------------------------------for (int i = 0; i < autoValuesBufferTab[position].valuesNumber; ++i) { if (isAxisVertical) { rawValue = computator.computeRawY(autoValuesBufferTab[position].values[i]); } else { rawValue = computator.computeRawX(autoValuesBufferTab[position].values[i]); //最后一个横坐标数据能够完全显示 if(i ==(autoValuesBufferTab[position].valuesNumber-1)){ rawValue-=10; } } if (checkRawValue(contentRect, rawValue, axis.isInside(), position, isAxisVertical)) { rawValuesTab[position][valueToDrawIndex] = rawValue; //+1 让横坐标为从0变为1 if(position==3){ autoValuesToDrawTab[position][valueToDrawIndex] = autoValuesBufferTab[position].values[i]+1; }else{ autoValuesToDrawTab[position][valueToDrawIndex] = autoValuesBufferTab[position].values[i]; } ++valueToDrawIndex; } }添加if(i ==(autoValuesBufferTab[position].valuesNumber-1)){ rawValue-=10; }空心坐标line.setHasPoints(true);line.setPointRadius(2);在LineChartRenderer文件中drawPoint函数下面if (ValueShape.SQUARE.equals(line.getShape())) { canvas.drawRect(rawX - pointRadius, rawY - pointRadius, rawX + pointRadius, rawY + pointRadius, pointPaint); } else if (ValueShape.CIRCLE.equals(line.getShape())) { canvas.drawCircle(rawX, rawY, pointRadius, pointPaint); canvas.drawCircle(rawX, rawY, pointRadius, pointStrokePaint);//加入空心坐标描边 } else if (ValueShape.DIAMOND.equals(line.getShape())) { canvas.save(); canvas.rotate(45, rawX, rawY); canvas.drawRect(rawX - pointRadius, rawY - pointRadius, rawX + pointRadius, rawY + pointRadius, pointPaint); canvas.restore(); } else { throw new IllegalArgumentException("Invalid point shape: " + line.getShape()); }


 220
220

 被折叠的 条评论
为什么被折叠?
被折叠的 条评论
为什么被折叠?
 到【灌水乐园】发言


