


fbprophet的探索历程
facebook开源了时间序列预测框架prophet,目前支持R语言和python语言。托管在github上:https://github.com/facebookincubator/prophet。本文将使用python对该框架的使用。
开发环境的搭建:
在Linux环境下,搭建会简单些,fbpropeht依赖pystan,numpy,pandas,所以首先要安装这个三个库:(当然,需要先安装python环境,Linux一般自带,如果没有,可以自行搜索下安装方法)
pip 的安装:
sudo apt-get install python-pip依赖库的安装:
sudo pip install pystan
sudo pip install numpy
sudo pip install pandaspip install fbprophetloaderbox@loaderbox-desktop:~$ python
Python 2.7.12 (default, Nov 19 2016, 06:48:10)
[GCC 5.4.0 20160609] on linux2
Type "help", "copyright", "credits" or "license" for more information.
>>> from fbprophet import Prophet
>>>
环境搭建成功之后就能直接使用fbprophet了。github上面的quick start 介绍了fbprophet的基本使用:https://facebookincubator.github.io/prophet/docs/quick_start.html
其中使用到的样本也在github上,所以大家最好先git下来:
git clone https://github.com/facebookincubator/prophet.git

那么,现在就使用fbprophet来实现预测。(以时间:天为粒度,目前,fbprophet支持的最小粒度为:天(截止我写这篇博客时,是不支持小时的),如果想去预测以小时为粒度的数据,需要对源码作出一些修改,会在下一篇博客上说明)
第一步,读取数据:(先要导入pandas、numpy和Prophet)
import pandas as pd
import numpy as np
from fbprophet import Prophet
from matplotlib import pyplot as plt

file_path= '/home/loaderbox/ecr/prophet/examples/example_wp_peyton_manning.csv'
df = pd.read_csv(file_path) ds y
0 2007-12-10 14629
1 2007-12-11 5012
2 2007-12-12 3582
3 2007-12-13 3205
4 2007-12-14 2680
5 2007-12-15 2401
6 2007-12-16 4510
7 2007-12-17 6831
8 2007-12-18 4370
9 2007-12-19 3196
10 2007-12-20 2642第二步:创建一个Prophet对象
prophet = Prophet()def __init__(
self,
growth='linear',
changepoints=None,
n_changepoints=25,
yearly_seasonality=True,
weekly_seasonality=True,
daily_seasonality=True,
holidays=None,
seasonality_prior_scale=10.0,
holidays_prior_scale=10.0,
changepoint_prior_scale=0.05,
mcmc_samples=0,
interval_width=0.80,
uncertainty_samples=1000,
):changepoints:指定潜在改变点,如果不指定,将会自动选择潜在改变点例如:
changepoints=['2014-01-01']n_changepoints:默认值为25,表示changepoints的数量大小,如果changepoints指定,该传入参数将不会被使用。如果changepoints不指定,将会从输入的历史数据前80%中选取25个(个数由n_changepoints传入参数决定)潜在改变点。
yearly_seasonality:指定是否分析数据的年季节性,如果为True,最后会输出,yearly_trend,yearly_upper,yearly_lower等数据。
weekly_seasonality:指定是否分析数据的周季节性,如果为True,最后会输出,weekly_trend,weekly_upper,weekly_lower等数据。
daily_seasonality:这是是我自定义的参数,前面有说到,目前fbprophet不支持以小时为粒度的数据,所以,我在这里添加了这个参数,会在下篇博客上说明
holidays:传入pd.dataframe格式的数据。这个数据包含有holiday列 (string)和ds(date类型)和可选列lower_window和upper_window来指定该日期的lower_window或者upper_window范围内都被列为假期。lower_window=-2将包括前2天的日期作为假期,例如:(这个是官方的quick start中的季后赛和超级杯两个假期的指定)
# Python
playoffs = pd.DataFrame({
  'holiday': 'playoff',
  'ds': pd.to_datetime(['2008-01-13', '2009-01-03', '2010-01-16',
                        '2010-01-24', '2010-02-07', '2011-01-08',
                        '2013-01-12', '2014-01-12', '2014-01-19',
                        '2014-02-02', '2015-01-11', '2016-01-17',
                        '2016-01-24', '2016-02-07']),
  'lower_window': 0,
  'upper_window': 1,
})
superbowls = pd.DataFrame({
  'holiday': 'superbowl',
  'ds': pd.to_datetime(['2010-02-07', '2014-02-02', '2016-02-07']),
  'lower_window': 0,
  'upper_window': 1,
})
holidays = pd.concat((playoffs, superbowls))
这里再引用下官方的一段话进行补充说明:
You can also include columns lower_window and upper_window which extend the holiday out to [lower_window, upper_window] days around the date. For instance, if you wanted to included Christmas Eve in addition to Christmas you’d include lower_window=-1,upper_window=0. If you wanted to use Black Friday in addition to Thanksgiving, you’d include lower_window=0,upper_window=1.seasonality_prior_scale:季节性模型的调节强度,较大的值允许模型以适应更大的季节性波动,较小的值抑制季节性。
holidays_prior_scale:假期组件模型的调节强度。
changepoints_prior_scale:自动的潜在改变点的灵活性调节参数,较大值将允许更多的潜在改变点,较小值将允许更少的潜在改变点。
mcmc_samples:整数,若大于0,将做mcmc样本的全贝叶斯推理,如果为0,将做最大后验估计。
指定贝叶斯抽样,例如mcmc_samples=20,
Iteration:  1 / 20 [  5%]  (Warmup) (Chain 0)
Iteration:  2 / 20 [ 10%]  (Warmup) (Chain 0)
Iteration:  4 / 20 [ 20%]  (Warmup) (Chain 0)
Iteration:  6 / 20 [ 30%]  (Warmup) (Chain 0)
Iteration:  8 / 20 [ 40%]  (Warmup) (Chain 0)
Iteration: 10 / 20 [ 50%]  (Warmup) (Chain 0)
Iteration: 11 / 20 [ 55%]  (Sampling) (Chain 0)
Iteration: 12 / 20 [ 60%]  (Sampling) (Chain 0)
Iteration: 14 / 20 [ 70%]  (Sampling) (Chain 0)
Iteration: 16 / 20 [ 80%]  (Sampling) (Chain 0)
Iteration: 18 / 20 [ 90%]  (Sampling) (Chain 0)
Iteration: 20 / 20 [100%] (Sampling) (Chain 0)interval_width:浮点数,给预测提供不确定性区间宽度,如果mcmc_samples=0,这将是预测的唯一不确定性,如果mcmc_samples>0,这将会被集成在所有的模型参数中,其中包括季节性不确定性
uncertainty_samples:模拟绘制数,用于估计不确定的时间间隔
第三步,填充数据并准备预测的数据框架:
df['y'] = np.log(df['y'])
prophet.fit(df)
future = prophet.make_future_dataframe(freq='D',periods=periods)fit(df)填充数据.
make_future_dataframe()准备预测的数据框架,该函数的定义如下:
    def make_future_dataframe(self, periods, freq='D', include_history=True):
        last_date = self.history['ds'].max()
        dates = pd.date_range(
            start=last_date,
            periods=periods + 1,  # closed='right' removes a period
            freq=freq,
            closed='right')  # omits the start date

        if include_history:
            dates = np.concatenate((np.array(self.history['ds']), dates))

return pd.DataFrame({'ds': dates})include_history:是否包含历史数据,保持默认就好。
第四步,预测:
forecasts = prophet.predict(future)可以将预测结果显示出来:
forecasts的keys如下:
['ds', 't', 'trend', 'seasonal_lower', 'seasonal_upper',
       'trend_lower', 'trend_upper', 'yhat_lower', 'yhat_upper', 'daily',
       'daily_lower', 'daily_upper', 'weekly', 'weekly_lower',
       'weekly_upper', 'yearly', 'yearly_lower', 'yearly_upper',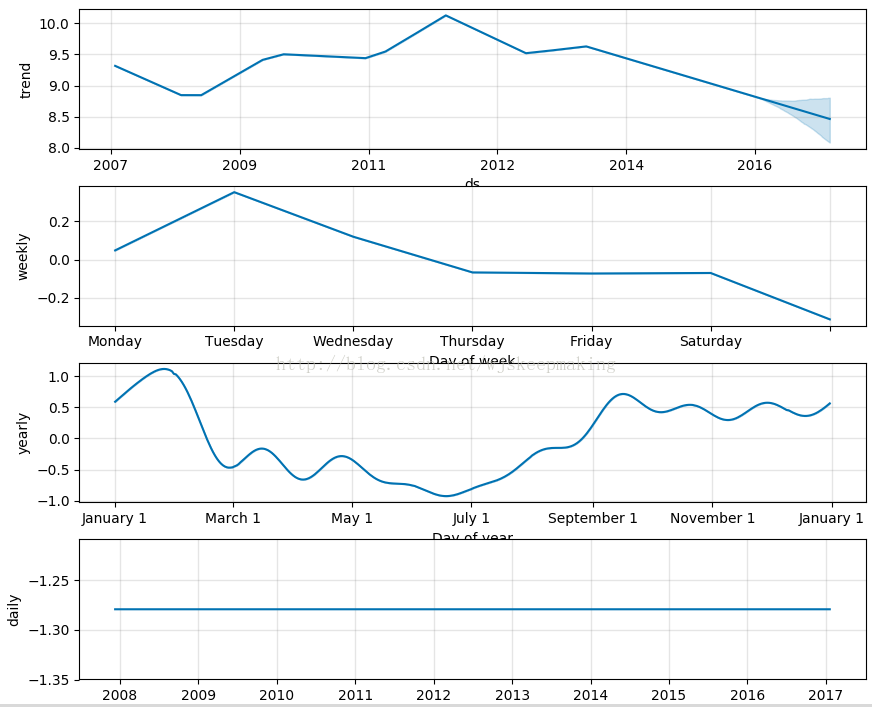
'seasonal', 'yhat']prophet.plot(forecasts).show()
prophet.plot_components(forecasts).show()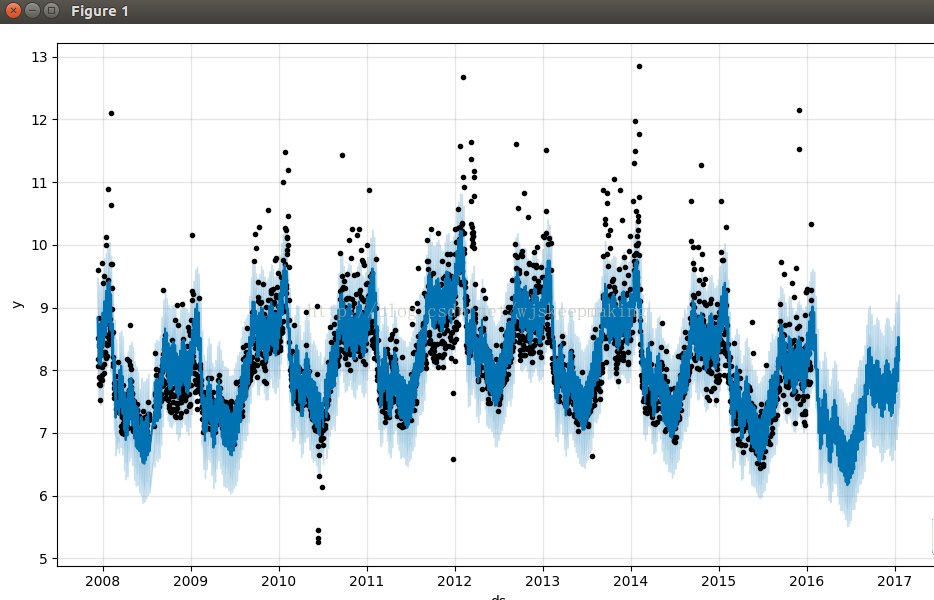
说明:图中浅蓝色表示yhat_upper和yhat_lower,受到interval_width这个参数的影响,当然,从forecasts的keys中可以看到,还有其他的_upper和_lower,同样也会受到这个参数的影响。
基本上,到此就是fbprophet的使用了,对于那些__init__函数中传入的参数对预测结果的影响,如果有兴趣,可以去阅读下源码,琢磨一下这些参数的含义。
上面的内容也是我自己摸索出来,会存在一些错误,请大家在评论中指出,互相学习。
下篇博客将会介绍如何添加以小时为粒度的支持:修改fbprophet源码以支持以小时为粒度的预测


 2859
2859

 被折叠的 条评论
为什么被折叠?
被折叠的 条评论
为什么被折叠?
 到【灌水乐园】发言


